Chapter 13
Mergers and Acquisitions
Mergers and acquisitions (or M&A, as it's referred to among capital markets professionals) refers to the wheeling and dealing that transpires when one company decides to buy another. The acquisition target company can be paid for in outright cash, in which case it is a purchase, or it can be paid for in shares of stock, in which case it is technically a merger of two companies. Either way, one company ends up being the acquiror and the other winds up being acquired. Sometimes, you may hear people talk of a “merger of equals,” which suggests a business combination and not really an acquisition. Such events happen, but they are rare and often risky. One of the biggest such events was the 1998 “merger” of automobile manufacturers Chrysler and Daimler-Benz, which was really a $37 billion buyout, and which fell apart in 2007 when Daimler-Benz unceremoniously unloaded its American partner, effectively paying private equity firm Cerberus Capital to take over Chrysler's operations. For its part, Cerberus infused over $7 billion into the company before the company's equity value was effectively wiped out in a bankruptcy filing two years later.
There can be many reasons for a company to grow through business acquisitions. High on the list is operational synergies, which means that you are able to combine another company into your own company and improve your operating profit margin by spreading your relatively fixed operating costs over a larger enterprise. With greater size may also come purchasing efficiencies, whereby you are able to earn greater discounts on the cost of inventory and supplies. Maybe you simply have a better operating model, which can improve the operating profit margin of the company you are acquiring. The company you acquire may be operating in a different geographic market with a different customer base, which allows you to lower your company's operating risk through greater customer diversity. Or perhaps the targeted company sells different products that are complementary to yours, allowing you to be more competitive, possess a more complete business line and be a “one-stop shop.”
Whatever the reason, a company's acquisition of another company should enhance its long-term corporate business model and raise its prospects for wealth creation.
Of course, there is one more major reason to buy a company: You are not now in business, but see a business you like, believe in, and believe you can run – and you want to own it. Many businesspeople eventually become business owners not by starting a company but by buying an existing business.
Whether you are the leader of a company contemplating an acquisition or an individual considering a company investment or purchase, one key question is the same: How much should you pay? By now, being versed in current shareholder returns and in the components of building a business, you should have a pretty good idea of how to value a business.
Importantly, buying an existing enterprise means that you are likely to have a clear idea of the business investment required. You will also know the revenues and the operating profit margin, and you will also have an idea of your maintenance capex requirements. So, when it comes to buying a company, the amount and cost of OPM tend to be the two greatest unknowns of the Six Variables. These two variables guide the formation of your capital stack, since the percentage funded with equity, the final piece of the puzzle, is simply the inverse of the percentage of your company purchase price to be funded with OPM.
OPM Capital Options
When it comes to buying an existing business, you'll likely want to craft your own OPM stack from scratch. Your goal in assembling an OPM stack will generally be to start with the longest-term OPM possible having the lowest monthly payment requirements. This order of operations was first discussed in chapter 3, but we will expand on it here.
The name of the game is to keep your payment constant (your annual payment on OPM proceeds as a percentage of the OPM proceeds) as low as possible. Drawing on and expanding our earlier discussion, here are some of the many OPM capital options to be considered:
- Asset-backed lines of credit (ABLs). These are credit lines, mostly from banks, which are secured by inventory and accounts receivable, with advances and line availability tied to the amount of eligible collateral. These borrowings are generally allowed to be “interest only” because the source of repayment is viewed by lenders to not be free corporate cash flow after interest expense, but the conversion of the assets (inventory and accounts receivable) into cash through the operating cash flow cycle of the company. ABL facilities are appropriate where the proportion of assets centered in accounts receivable or inventory is higher.
- Real estate or equipment loans. If the business needs real estate or equipment to operate, then the assets may be financeable over long periods of time, since they tend to be long-lived assets. Lenders may include banks or insurance companies, to name two.
- Real estate or equipment leases. For businesses using real estate and equipment, another option is to lease them. This capital solution is where I have personally spent most of my career and is valuable because it's fixed rate, replaces both borrowings and the equity needed to purchase real estate, and has the lowest payment constant you can generally get from OPM.
- Term debt secured by assets. This is debt (mostly from banks and other finance companies) having a schedule of repayment over time. The assets pledged can range from furniture, fixtures, and equipment to intellectual property. In many cases, OPM providers will be willing to simply lend based on the recurring cash flow of the business. Often, principal payments start off being very modest and then grow over time with corporate free cash flow.
- Other term debt flavors. Occasionally, asset-based credit facilities and term borrowings will be effectively combined into what lenders call “unitranche” borrowings. “Tranche” is a word that comes from old French, literally means “slice,” and is used in finance to denote debt demarcations. For instance, over my career, our companies have issued multiple term notes secured by the same assets, with some notes (or tranches) being senior to others and being assigned different credit ratings. In my experience, unitranche lenders often tend to be non-bank finance companies.
- Assumed borrowings. There may be some borrowings at the company that are worth assuming. Or perhaps there are borrowings that cannot be prepaid and need to be a part of your capital structure. Prepayment penalties associated with company purchases are not uncommon and represent an added buyer business investment.
- Mezzanine borrowing. A “mezzanine” is generally a floor between the first and second in a building, often with a view of the lobby. Likewise, mezzanine debt is also not on the ground floor, with the accompanying first lien position on assets. Mezzanine debt is junior to most other borrowings and often lightly secured with junior asset liens. Sometimes, mezzanine borrowings can be included in a unitranche lending solution. The good news about mezzanine debt is that it is long term. It will tend to be meaningfully more expensive than senior lien borrowings, but often some of the interest payments do not have to be paid in cash; that portion of the interest owed is occasionally “payment in kind,” or PIK interest, which means that it is accrued and added to the loan balance.
- Seller financing. If sellers are willing to carry back financing, this can be a great way to finance a company because such financing is most often unsecured, generally subordinated to other borrowings, viewed by banks and other sources of capital to be like equity, and often interest-only and long term. Basically, it can be a cheaper and easier form of mezzanine debt.
I should add there may be other sources of such junior or mezzanine capital out there, not the least of which will be friends and family.
Finding the right mix of OPM is not easy. There are numerous sources of capital available that generally depend on company size and type. For instance, asset-backed lines of credit tend to be used for companies having large amounts of inventory and accounts receivable. Such companies can range from FUBU, which we discussed in chapter 2, to automobile dealerships, which obtain asset-based lines of credit called “floorplan” lines to finance their vehicle inventory.
Smaller companies may have access to Small Business Administration (SBA) borrowings. The SBA was set up in by Congress in 1953 to encourage bank loans to fledgling companies. SBA loan programs enable banks to write small business loans while undertaking less risk of loss owing to the government agency loan guarantees that range from 50% to 85% of the principal provided.
There is a veritable alphabet soup of capital suppliers set up to deliver you OPM as you, or the business you lead, seek to buy a company. In truth, putting an optimal capital stack together can be highly creative and may include such elements as preferred stock (non-voting equity that is simply entitled to a defined yield) or debt having ownership conversion rights. Likewise, preferred stock and convertible debt might be redeemable on the option of the OPM issuer or callable (prepaid) upon your option.
Personally, I find all the OPM options to be fascinating. Indeed, the menu of OPM offerings and the list of OPM providers has greatly changed over my career. Conceiving and sourcing the amount of OPM you can prudently use to buy a company is often a puzzle that can take some time to solve.
Solving for Equity and Company Valuation
Once you have determined the amount of OPM you are willing to take on to make a company purchase, you can determine company value and the amount of equity you require. The three steps of solving for equity and company value are simple:
You may be wondering how to compute the required equity rate of return. Until now, I have simply said that this is an investor yield that is deemed acceptable, given company risks and growth prospects. Hence, in our often-used restaurant case study, the current pre-tax equity rate of return is 85% for the original investor, while the subsequent investor is happy to achieve a 20% current pre-tax rate of return. There are certainly theories written in business textbooks regarding the determination of expected rates of return. However, my experience is that there is a great variance in the range of corporate business valuations that defy textbook analysis. I have seen people harness Mort's Model and buy companies with virtually nothing down. I have also witnessed business purchasers make substantial equity commitments while chasing after comparatively modest current equity returns. With this being the case, it does not always follow that the amount of equity committed to a company accompanies higher equity valuation.
At our first public company, the biggest private company tenant business failure we encountered was ironically the one having the highest level of shareholder equity commitment.
Sometimes, there are great deals to be had and, other times, not. The law of large numbers, when looked at over a long time, may suggest that there is rhyme and reason to company valuations. I am personally less convinced. There are simply too many elements that can influence company valuations, starting with the motivations of the seller and buyer, and the type and length of the auction process used.
It is rare for company purchase prices to make sense just by maintaining the operational status quo. Ideally, you would like to be able to run a company just as the seller had and realize attractive current equity returns, together with added potential for growth. However, frequently, sellers understand that their companies have the potential for corporate operating efficiency improvements. As a result, sellers often demand elevated prices that drive down current equity returns, compelling corporate efficiency improvements to justify the price paid for the business.
That work generally includes pulling your financial levers, which we described in chapter 7, including:
- Improved operating efficiency, with operating margins enhanced through increased sales, reduced costs, or operational synergies with your existing business.
- Improved asset efficiency realized by shortening the cash flow cycle (assuming an operating model that is more “asset light”) or other initiatives to lower the amount of business investment.
- Improved capital efficiency realized through a more optimal OPM mix or other initiatives designed to lower your comparative cost of capital.
Assuming operational and asset efficiency improvements are to be incorporated in a business purchase, your corporate valuation methodology will often require adjustments by modifying operating profitability and business investment in the first two steps of business valuation shown earlier.
Now, you are paying a price for the company based on its operating fundamentals and also based on improvements that you stand to deliver.
EBITDA Valuation Multiples
It is commonplace for articles on M&A to discuss company business valuations as being a multiple of earnings before interest, taxes, depreciation, and amortization (EBITDA). In fact, corporate EBITDA valuation multiples are commonly spoken of as if they represented effective valuation benchmarks. Perhaps this might be the case for companies having similar business model characteristics. However, my view is that EBITDA multiples are simply numbers derived from the three-step business valuation approach illustrated at the beginning of this chapter. One obvious reason for this is that EBITDA multiples are based on accounting conventions, whereas the three-step process shown earlier is a financial construct. Finance always rules.
One shortfall of the use of accounting-driven conventions like EBITDA multiples pertains to the issue of lease capital OPM proceeds. While some companies elect to own their real estate and equipment, others will prefer to lease it from companies similar to the ones I have helped lead. Since the computation for EBITDA is after rent expense, the resultant valuation multiple will exclude the proceeds from lease OPM providers, making the company's EBITDA valuation multiple appear smaller. Conversely, companies owning and financing their real estate and equipment will often appear to have traded at much higher EBITDA multiples. Obviously, none of this makes any sense.
Finally, the use of EBITDA multiples as valuation benchmarks assumes that a company's entire capital stack is essentially a commodity and subject to little variance. In my experience, this is far from true. Over the years, I have seen many instances of M&A transactions where intelligent capital stack decisions made all the difference to the winners in an auction process or even to the ability of company acquirors to approach Mort's Model. Companies purchased with little or no equity are often a result of a lack of seller capital stack sophistication or a sufficient auction process. Oftentimes, strategies to minimize transaction frictional costs or potential tax liabilities can play a meaningful role in capital efficiency improvements that can make a corporate acquisition worthwhile.
For the sellers and staff of a business being marketed for sale, one important question to answer is whether or not the acquiror is a strategic investor. A strategic investor is one that already operates other companies (potentially competitors) in similar business lines that stand to benefit from the corporate acquisition. Strategic investors tend to seek to eliminate duplicative overhead and consolidate locations. They often look at the businesses they acquire not as independent fully functioning entities but as parts having the potential to contribute to EMVA creation for their existing machine.
Because of this, company sellers and their leadership teams are often wary of strategic buyers. Assuming the price disparity is not prohibitive, company owners tend to prefer selling their businesses to buyers who will be the least disruptive to the company they have founded or cared for. Non-strategic investors tend to be the least disruptive to the existing corporate business model and to the leaders and staff that direct company operations.
M&A Risks and Rewards
Numbers do not simply happen. People make them happen. This means that M&A is fraught with risk. Frequent studies that address public company M&A activity estimate its failure rate to range between 70% and 90%.1 By contrast, the M&A failure rate for private equity firms tends to be far less, owing to fewer integration and leadership disruption issues.
Why do so many strategic public company M&A transactions fail? At the top of the list is people and culture; the nine-year shotgun marriage of Daimler-Benz and Chrysler was plagued by cultural friction. Differences in corporate cultures can lead to management disfunction, not to mention key staff departures. Over my career, I have frequently seen the destructive impacts of such friction with the combinations of banks and brokerage firms that represented important financial services providers for our platforms. As the saying goes, “Some of your best assets wear shoes,” and they can choose to walk out the door.
Another cause of failure is centered in overeager buyers who simply pay too much. The excessive valuation might be tied to inflated views regarding revenue growth potential or excess confidence in the ease of pulling various efficiency levers.
Sometimes such failures in business valuation have an assist from overeager OPM providers that collectively burden the company with excessive payment requirements relative to the ability of the business model to deliver. As a career-long OPM provider, I can testify to witnessing occasional acts of “irrational exuberance,” to quote a term coined by Alan Greenspan when, as chairman of the Federal Reserve Bank, he commented on the dot-com phenomenon in 1996, well before the bubble popped.
Sometimes, failures simply arise from insufficient margins for error, with inadequate liquidity to address business plan shortfalls.
When talking about the greatest drivers of business failure for established businesses, I generally point to two key corporate risks that involve growth.
The number one risk of corporate failure pertains to buying one or more companies carelessly. Corporate M&A is generally referred to as “inorganic growth” because the growth being grafted onto a business comes from the outside and was created by others. All businesses have certain corporate competencies, but buying and assimilating other businesses are often not two of them. Sometimes the lack of specialized staff needed to value, diligence, and assimilate other businesses proves costly. Even when acquisitions succeed, the integration process can be expensive and take time. Given such M&A dynamics, operating profit margins often initially compress before they get better.
The second key business failure risk pertains to excessive organic expansion. The example of Lone Star Steakhouse & Saloon in the prior chapter represents one such cautionary tale. Growing from 116 restaurant locations in 1994 to 265 locations three years later imposed material operational stresses, not to mention collective simultaneous bets placed on hastily acquired and costly real estate locations. The company did not file for bankruptcy until years later, but this three-year expansion sowed the seeds of failure, wiping out all the company's EMVA and then some. By 1998, the company was worth materially less than it cost to put in place.
When it comes to the dangers imposed by corporate M&A strategies, public company experiences can be instructive because the successes and failures are more widely visible and can seem so much more spectacular.
Given the many risks associated with M&A transactions, and as a long-time business leader, it is easy to envision nightmare scenarios. However, there are many examples of M&A successes, especially with granular, programmatic add-on investment activity. A few notable high-profile public company M&A successes include:
- Google + Android. In 2005, Google acquired Android, a mobile phone software company, for a rumored $50 million. In just 10 years' time, Android software was the top mobile phone operating system, powering approximately 80% of all smartphones.2
- Disney + Pixar. A year after Google's Android purchase, Walt Disney Company successfully acquired computer animation pioneer Pixar for $7.4 billion in an all-stock deal. By 2020 Pixar had produced 15 of the top 50 highest grossing movies of all time, with more than half its feature productions earning Academy Awards for Best Animated Feature Film.3
- Facebook + Instagram. In 2012, Facebook acquired Instagram, a fledgling social media and photo sharing company having 25 million users that was in the early stages of launching its application on Android phones.4 The price paid for this company having just 13 employees was a staggering $1 billion.5 By 2020, the number of Instagram users had skyrocketed to over 1 billion, inspiring federal and state governments to seek Facebook's break-up as a result of its perceived social media dominance.
M&A Nightmares
In contrast to these notable successes, many public company M&A adventures have led to disasters that are chilling in their magnitude.

- Bank of America + Countrywide Mortgage. When it comes to evaluating losses relative to transaction value, few M&A failures loom larger than the acquisition of Countrywide Mortgage by Bank of America. The year was 2008, the sub-prime mortgage failure was playing out, and, with it, the Great Recession. Countrywide, the largest residential mortgage issuer in the country, had seen its share value reach an all-time high in 2007. However, later that same year, reporting its first-ever quarterly loss and low on cash and liquidity due to poor mortgage performance, Countrywide stood on the brink of failure. In January 2008, seeing an opportunity to acquire the nation's leading residential mortgage issuer at a bargain basement price, Bank of America decided to jump in. Normally, the loss downside on a company purchase is not materially more than the price paid, in this case $2.5 billion. However, by August 2014, it became apparent that Countrywide was not merely failing, it was toxic. Estimates of the bank's loss on the Countrywide purchase topped $50 billion, wiping out an estimated two thirds of its earnings on every other line of its combined business since the acquisition.6 Not only did Bank of America endure losses from Countrywide's operations, but it endured a myriad of lawsuits and regulatory actions arising from Countrywide's activities prior to the bank's ownership.

- Time Warner + America Online. In 2000, before the bloom was yet off the dot-com bubble, Time Warner, an established publishing, media, and cable TV powerhouse, elected to take a strategic leap. Their target was America Online, an early internet pioneer that delivered dial-up internet access to over 20 million clients, providing an early taste of the potential for email and internet searches.7 The method was the largest merger in history. Through the merger, AOL acquired Time Warner for $182 billion in stock and assumed debt, allowing Time Warner shareholders to own 45% of the combined enterprise, though they would be initially contributing 70% of the consolidated company profits. Time Warner's chief executive officer, Gerald Levin, retained his title for the combined company, while Steve Case, AOL's chief executive officer, assumed the role of chairman.
The merger euphoria was short-lived. At the time of the merger, customers with emerging broadband technology amounted to a scant 3% of total internet users, a number that seemed inconsequential to AOL with its monthly subscription business model built on ubiquitous telephone dial-up technology. But fast and powerful broadband quickly supplanted clunky dial-up.8 That Time Warner's leadership missed this technology trend was ironic, since the company would eventually benefit from the sale of broadband services as one of the nation's major cable TV providers.
Google, which would ultimately offer consumers superior internet search services for free, realized its first profits the year following the merger consummation. Another year later and AOL-Time Warner incurred an eye-popping $99 billion goodwill business valuation write-down. (Remember that accounting non-cash write-downs like this do nothing to alter actual business investment, but rightly signal the lower equity returns realized from poor investment decisions.) With AOL bleeding subscribers and subscription revenues, the company's equity market valuation plummeted over 90% from $226 billion to just $20 billion.
Prior to the merger, the equity valuation of Time Warner stood at north of $80 billion, meaning that the merger ultimately cost its own shareholders nearly 90% of their company value. AOL would eventually be sold to Verizon for the paltry price of $4.4 billion in 2015 before ultimately being jettisoned at a further loss to a private equity firm in 2021.
M&A failures are generally not explosively high profile, as in the case of the Countrywide Mortgage and AOL mergers. In both of those cases, it could be argued that the buyers overlooked various potential catastrophic risk threats. In the case of Bank of America, it was the risk of stepping into the corporate liability shoes of Countrywide Mortgage, a result of Countrywide becoming a wholly owned corporate subsidiary. In the case of Time Warner, it was understanding the massive industry disruption posed by broadband and the viability of a subscription business model in the face of future competitors offering superior services for free.
However, even with these two poster children of bad M&A decisions, one thing should stand out: Despite their gargantuan M&A-driven losses, both companies managed to survive. Both were large, highly capitalized public companies. The same cannot be said for private concerns, which comprise the vast majority of businesses in the United States. With most companies, poor M&A decision-making and integration has a higher potential to be catastrophic.
GE and M&A-Driven Growth
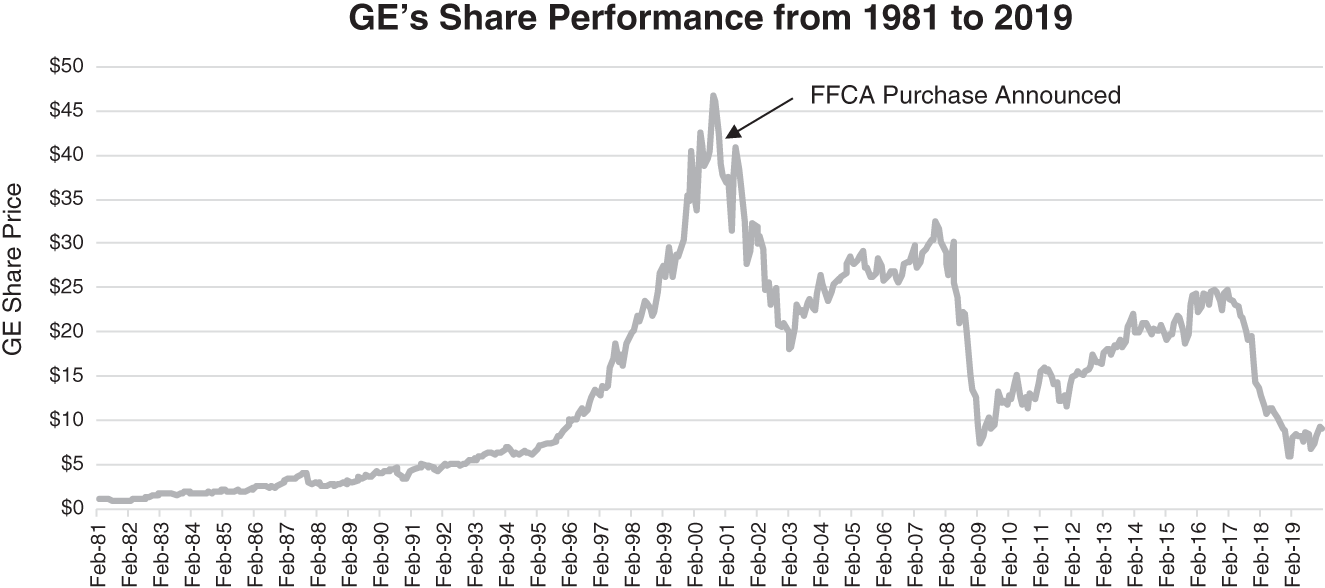
In August of 2001, I was serving as president of Franchise Finance Corporation of America (FFCA), a publicly traded New York Stock Exchange listed REIT. That month, we closed our sale of the company to a subsidiary of GE Capital. The acquisition of FFCA by General Electric (GE) would be the final corporate purchase under the watch of Jack Welch, a leadership icon who had guided the growth of GE since 1981. During his tenure, the company made approximately 1,000 such acquisitions,9 which were key to GE's growth strategy and which had helped to drive GE's share price to more than 45 times its 1981 value, or nearly $60 when they first approached us in 2000 to propose the acquisition. M&A activity was so much a part of GE's business model that each company division had its own business development group, which specialized in prospecting, valuing, bidding, acquiring, and integrating target companies.

Credit: Forbes magazine
Key to GE's M&A strategy was to purchase companies having current market equity returns higher than GE's. That way, the acquired businesses would help to elevate GE's market equity return and, along with it, GE's share price, assuming the market equity return demanded by GE shareholders remained the same.
While I prefer to speak of market current equity returns, stock investors might speak instead of share price/earnings multiples, which is the dominant valuation benchmark employed among equity investors. In my view, corporate valuation price/earnings multiples, like EBITDA multiples, are accounting-based derived numbers, with market and current equity returns ultimately lying at the center of business valuation.
M&A-driven earnings per share growth achieved through P/E multiple arbitrage is an old game. Conglomerates, of which GE was a prominent example, have historically been especially adept players because they are generally willing to buy such a wide array of businesses. During the 1960s, a number of conglomerates bearing names like names like LTV, ITT, Litton, Tyco, and Teledyne succeeded in realizing the illusion of earnings growth through a steady stream of corporate acquisitions that benefited from P/E multiple arbitrage. By the late 1960s, public company mergers were averaging 150 a month, with most of the most valuable companies in America characterized as conglomerates.10 In 1968, the peak year of the “conglomerate boom,” public U.S. corporations completed approximately 4,500 mergers, a stunning record.11
Around the time that we announced GE's intent to buy FFCA, GE's shares were valued at nearly 40 times trailing earnings. Meanwhile, we were acquired for a substantially lower multiple, meaning that GE's shareholders would benefit from the added value created by multiplying our earnings by the wide differences in our respective multiples. More than that, GE Capital, the finance subsidiary that acquired us, had a far more advantageous capital stack benefiting from less costly borrowings and a far greater use of OPM. Overlaying GE's capital stack onto FFCA served to reduce the acquisition P/E multiple further, contributing to greater earnings per share contribution from the acquisition. Of course, FFCA was small relative to a large company like GE. I estimate that the acquisition contributed well less than 1% to corporate earnings. But, add FFCA to an average of nearly 50 annually acquired companies during Jack Welch's tenure, and M&A stood to materially move the earnings growth needle. Indeed, it could be said that M&A activity proved important to the achievement of steady corporate earnings growth that was noted for its consistency under Welch. How much could the growth be? The simplistic table that follows does a good job illustrating the earnings growth impact of M&A activity. With target company acquisitions representing 10% of corporate enterprise value annually and a 15X multiple difference, earnings per share growth of better than 8% could be produced.
Acquiror Earnings Accretion from Positive P/E Multiple Acquisitions
| Percent of Company Represented by Target | ||||||
|---|---|---|---|---|---|---|
| 10.0% | 20.0% | 30.0% | 40.0% | 50.0% | ||
| Acquiror Multiple Over Target | 1.0X | 0.6% | 1.3% | 2.1% | 3.3% | 5.0% |
| 5.0X | 2.8% | 6.3% | 10.7% | 16.7% | 25.0% | |
| 10.0X | 5.6% | 12.5% | 21.4% | 33.3% | 50.0% | |
| 15.0X | 8.3% | 18.8% | 32.1% | 50.0% | 75.0% | |
| 20.0X | 11.1% | 25.0% | 42.9% | 66.7% | 100.0% | |
M&A-driven earnings per share growth can generally be expected to last about a year, which generally means that more companies must be acquired in subsequent years to maintain the appearance of continuous growth. Of course, it also helps if the acquired companies are achieving rapid growth in their businesses.
In the case of FFCA, GE received help from M&A accounting that added to the initial multiple arbitrage. In purchasing a company, the assets of the acquired business must be appraised and then recorded on the financial statement of the acquiror for their fair market value. The difference, if any, between the company purchase price and the fair market value of its assets is recorded as “goodwill,” which is an intangible asset. In our case, we held thousands of real estate locations that each had to be valued. GE preferred a low (conservative) valuation because cheaper real estate would result in less annual depreciation expense, which would, in turn, elevate future reported earnings. Given cheap real estate, more of the M&A value of FFCA would rest in “goodwill,” which was fine because the intangible asset did not have to be amortized, or expensed, which would also stand to improve future reported earnings.
There was one last benefit to marking the real estate with a low value: Eventually, the same real estate could be sold off at elevated gains that would further drive future corporate earnings. GE engaged in material asset sales, which elevated current earnings at the cost of future earnings, since the assets would no longer be there to contribute to future revenues. The gains they reported from this activity were not indicative of their prowess of “buying low and selling high,” since they were aided by purchase accounting methodology that shifted much of the purchase value to goodwill. Accounting results can potentially obscure financial results, but only for so long.
Interestingly, six years after we sold FFCA to GE Capital, we would sell our second public company to a private equity consortium that sought a high real estate valuation for its M&A purchase accounting treatment. Their reasoning was to avoid the appearance that they had paid more money for our company than the real estate was worth. The result would be a corporate acquisition that recorded elevated asset values while having negligible goodwill. Over the following years, the high prices recorded for the real estate would result in reduced reported corporate profitability resulting from higher depreciation expenses.
As you saw in the prior chapter, the linkage between the valuation forces of public company equity returns and share performance is not always immediate. Part of the issue is centered in accounting noise which can cloud long-term business model attributes. In the case of highly active acquisitors like GE, the underlying business model and intrinsic growth becomes harder to see. Accounting can make this worse because there is such a wide latitude in how assets are valued, which can result in further near-term distortion. However, business model fundamentals, even of complex conglomerates like GE, ultimately become visible.
Once the acquisition-fueled growth stopped and the tenure of Jack Welch ended, GE's performance began to descend. Between 1981 and the end of 2001, GE's shares had increased in value by over 30X, while the dividend had grown 8.5X to 17 cents per share. I and others at FFCA were handed impressive and frameable stock option certificates giving us the right to buy GE shares at a fixed price of $44 over the ensuing 10 years.
Alas, GE's share price would not see $44 again. In June of 2018, GE became the last of the original members of the Dow Jones Industrial Average to be removed from the venerable stock index it had occupied for more than a century. A year later, GE's shares stood at a valuation of a little over $10, with a dividend at half the 1981 amount at the start of Jack Welch's tenure. Meanwhile, the company's credit rating fell eight notches from AAA to BBB+, while many of the 1,000 companies purchased during Jack Welch's tenure were jettisoned.
GE Capital, which had been a potent engine central to GE's consistent earnings growth, had been reduced to a fraction of its size, with remaining activities centered on providing financing to GE customers for GE-produced products. FFCA, along with the other GE Capital-acquired companies that became parts of GE Franchise Finance, was eventually sold off in pieces.
With all GE's divestitures, revenues in 2020 were roughly 40% lower than they were at the time of our 2001 acquisition and nearly 60% less than their 2008 all-time high. The final chapter of GE's incredible shrinking act was ultimately written by Larry Culp, the first outsider to ever become Chief Executive Officer of the storied company. In November 2021, the downsized company announced that it would split into three separate publicly traded companies, with activities centered in aviation, healthcare, and power delivery. With that defining conclusion, GE's days as a conglomerate were over.
In an irony not lost on any of us at STORE, we moved our offices in 2016 to a building originally constructed by GE to house FFCA's disbanded successor company.
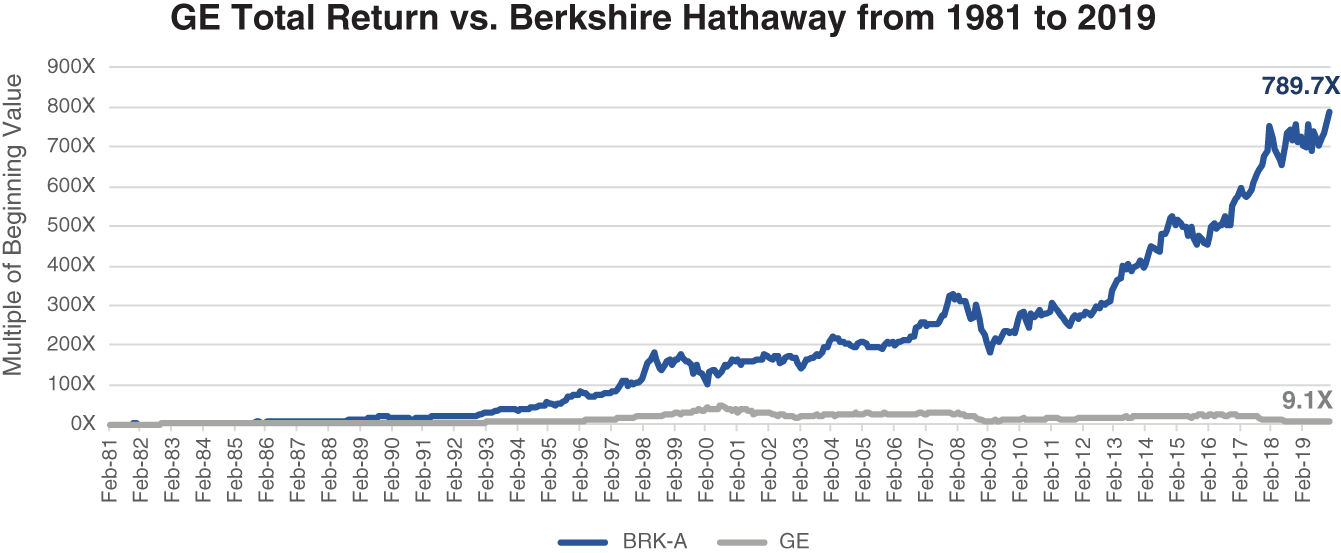
Focusing on What Matters
While Jack Welch averaged 50 corporate acquisitions annually over his tenure at GE, Warren Buffett, the legendary founder and leader of Berkshire Hathaway, in forging his successful conglomerate, averaged fewer than two annually. Unlike GE, Berkshire Hathaway had a holding company model in which the home office had scant staff, with each of the many corporate subsidiaries guided by their own capable leadership. In the course of producing compound annual rates of return of approximately 20% between 1965 and the end of 2020, Warren Buffett gained a deserved reputation as one of the finest stock pickers of all time, with Berkshire having realized outsized returns from a number of prescient public stock investments.
To my way of thinking, this is only partly true. Warren Buffett also proved very talented at corporate acquisitions, with large portions of Berkshire Hathaway's earnings delivered by wholly owned companies like See's Candies, insurer Geico, Berkshire Reinsurance, and Burlington Northern Santa Fe Railroad. With a strong AA-rated balance sheet and ample liquidity, Berkshire was able to advance $3 billion in needed liquidity to cash-strapped GE during the Great Recession in October 2008. The money was in the form of redeemable preferred shares yielding 10% annually, with added warrants to buy GE shares at a fixed price in the future. Between the dividends, the 10% preferred share redemption premium, and more than $300 million in profits from share sales, Berkshire Hathaway realized annual returns in excess of 15% from its GE investment, while GE's common shareholders received paltry returns by comparison.
Public companies, which include some of the nation's largest concerns, but which comprise about .1% of all US businesses, are not like the rest of corporate America in many ways. Accounting noise and animal spirits abound, and leadership and investors can be tempted to focus on comparatively short-term results. I have remarked often that the attention span of many investors is shorter than a round of golf. Given such short-term views, forces of growth, momentum, and national economic indicators can have a profound impact on share valuations. We have likewise witnessed share valuation moves simply because our company became included in an index of similar sized businesses.
Apart from selling two public companies, our leadership teams have historically avoided M&A activity. The reasons have generally related to suitability and to the impact of such acquisitions on our long-term growth. Over the short run—generally over one to two years—acquisitions can often look enticing. However, over the long term, they can often detract from growth. With that said, real estate investment trusts like STORE make asset investments every day, which can be thought of in the same way as an M&A transaction. Every real estate asset purchased has an investment amount, an operating profit margin, and is funded by a mix of OPM and equity. As a result, our companies prepared pricing models to understand what the expected rates of return are for the investments we made. While the companies I have helped lead have had a proud history of working to take a long-term approach to our investment activity and investment return expectations, the public markets can behave differently. At points in time where our shares have been more richly valued, the signal sent by the marketplace can be interpreted to say, “Buy anything and buy a lot!” That is because high equity valuations can make even low yielding investments or M&A activity accretive to earnings per share. But producing earnings per share growth is not the ideal goal. After all, as you have seen, companies can actually grow earnings per share while lighting a good chunk of value on fire.
The primary financial goal of the companies I have helped guide has always been to create value as measured by compound EMVA growth. Our view here has been that, like the rest of corporate America and over the long term, there is a valuation vortex around equity returns. Water always seeks its own level. Only with public companies, this can often take some time.
Notes
- 1. Roger L. Martin, “M&A: The One Thing You Need to Get Right” (June 2018), Harvard Business Review.
- 2. Doug Olenick, “Apple iOS and Google Android Smartphone Market Share Flattening: IDC,” Forbes, May 27, 2015.
- 3. Filmsite.org, The Pixar-Disney Animated Films, https://www.filmsite.org/pixaranimations.html.
- 4. Sarah Frier, “The Inside Story of How Facebook Acquired Instagram,” August 4, 2020, OneZero.Medium.com.
- 5. Salvador Rodriguez, “As Calls Grow to Split Up Facebook, Employees Who Were There for the Instagram Acquisition Explain Why the Deal Happened,” September 24, 2019, https://www.cnbc.com/2019/09/24/facebook-bought-instagram-because-it-was-scared-of-twitter-and-google.html.
- 6. Rick Rothacker, “The Deal That Cost Bank of America $50 Billion – and Counting,” The Charlotte Observer, August 17, 2014.
- 7. Tom Johnson, “That's AOL Folks,” January 10, 2000, http://money.cnn.com/2000/01/10/deals/aol_warner/.
- 8. Rita Gunther McGrath, “15 Years Later, Lessons from the Failed AOL-Time Warner Merger,” Fortune, January 10, 2015.
- 9. Thomas Gryta and Ted Mann, Lights Out (Houghton, Mifflin Harcourt, 2020).
- 10. Nicholas Gilmore, “The Forgotten History of How 1960s Conglomerates Derailed the American Dream,” The Saturday Evening Post, November 1, 2018.
- 11. John Brooks, The Go-Go Years: The Drama and Crashing Finale of Wall Street's Bullish 60s (Allworth Press, 1973).