
CHAPTER 7
Profiling Perspectives of Risk Dimensions in Islamic Finance: Descriptive Questionnaire Data Analysis
This chapter, the first of the empirical chapters, summarises the descriptive findings from the collected primary data in terms of providing a quantitative analysis of respondents' answers to the self-administrated questionnaire. The questionnaire follows the structure explained in Chapter 6, Research Framework and Methodology, with the aim of empirically answering the research questions.
The chapter begins by providing a descriptive analysis of the general characteristics of the respondents. Then the research questions and hypotheses, explained in the previous chapter, are tested and general observations are made of the findings. Cross-tabulation and descriptive statistics are used to provide indications of respondents' perceptions. The findings are examined with respect to the extant literature review, while the second part of quantitative analysis – inferential statistics – is presented in the Chapter 8. A more complete discussion of the research findings will be provided in Chapter 10 in the context of existing knowledge and information, and also in association with the findings of the qualitative interview analysis, which will be separately presented in Chapter 9.
DATA ANALYSIS AND RESULTS
As mentioned in Chapter 6, the questionnaire survey was conducted between February and November 2010. The questionnaires were distributed to 110 respondents in 18 selected countries among six global regions. The final sample comprised of 72 surveys – a final response rate of 65.5%. The sample represented a diverse geographic spread of institutions, and respondents were spread across different departments and held different positions within their organisations.
Characteristics of the Respondents
The first part of the questionnaire aimed at identifying different characteristics of the respondents. Among the many variables used in the study, the main control variables used to assess the respondents' profiles are the primary location of the financial institution, nature of operations and activities, and the accounting standards used. These control variables aim to test the effect of these characteristics on the respondents' answers.
Table 7.1 depicts the findings in relation to the primary country of operation of the financial institution, which indicates that the majority of participating banks are located in the UK followed by Egypt, Bahrain and France. GCC countries and Malaysia follow, while Jordan, Pakistan, Palestine, Singapore and Turkey are each represented by one financial institution in the sample.
TABLE 7.1 Geographic distribution of the study sample
| Country | Number of Questionaires | Percent of Final Sample |
| UK | 21 | 29% |
| Egypt | 9 | 13% |
| Bahrain | 6 | 8% |
| France | 4 | 6% |
| Germany | 4 | 6% |
| Qatar | 4 | 6% |
| Kuwait | 3 | 4% |
| Malaysia | 3 | 4% |
| Saudi Arabia | 3 | 4% |
| Syria | 3 | 4% |
| UAE | 3 | 4% |
| Switzerland | 2 | 3% |
| US | 2 | 3% |
| Jordan | 1 | 1% |
| Pakistan | 1 | 1% |
| Palestine | 1 | 1% |
| Singapore | 1 | 1% |
| Turkey | 1 | 1% |
| Total | 72 | 100% |
In addition, Table 7.2 combines the financial institution's main region of operation with the respondents' positions. As can be seen in Table 7.2, Heads of Risk Management and Risk Managers represent more than 32% of the sample, followed by General Managers and Managing Directors. Respondents included only one Head of Investment Banking and one Shari'ah scholar. The participants' length of service at their organisations does not form part of this questionnaire.
TABLE 7.2 Breakdown of the positions of the participants
| Participant's Role | Americas | Europe | GCC | Other | Other Middle East | Southeast Asia | Total (Count) | Total (%) |
| Analyst | 1 | 2 | 2 | 5 | 7% | |||
| Auditor | 2 | 2 | 3% | |||||
| CEO | 2 | 1 | 1 | 1 | 5 | 7% | ||
| Chief Financial Officer | 1 | 1 | 2 | 3% | ||||
| Consultant | 2 | 2 | 3% | |||||
| Director | 5 | 1 | 6 | 8% | ||||
| General Manager | 4 | 6 | 10 | 14% | ||||
| Head of Investment Banking | 1 | 1 | 1% | |||||
| Head of Risk Management | 8 | 3 | 11 | 15% | ||||
| Managing Director | 1 | 4 | 3 | 8 | 11% | |||
| Risk Manager | 1 | 4 | 3 | 1 | 3 | 12 | 17% | |
| Senior Analyst | 3 | 1 | 4 | 6% | ||||
| Senior Trader | 1 | 1 | 2 | 3% | ||||
| Shari'ah Scholar | 1 | 1 | 1% | |||||
| Solicitor | 1 | 1 | 1% | |||||
| Total (Count) | 2 | 31 | 19 | 2 | 14 | 4 | 72 | |
| Total (%) | 3% | 43% | 26% | 3% | 19% | 6% | 100% |
The nature of the participating financial institutions is also investigated. As can be seen in Table 7.3, out of the 72 institutions that participated in this study, 34.7% were fully fledged Islamic banks, with the remainder being conventional banks with Islamic activities (19.4%), conventional banks (27.8%) and others (18.1%).
TABLE 7.3 Nature of financial institution
| Region | |||||||
| Nature of Institution | Americas | Europe | GCC | Other | Other Middle East | Southeast Asia | Total |
| Audit Firm | 3% | 3% | |||||
| Brokerage | 1% | 1% | |||||
| Consulting Firm | 3% | 3% | |||||
| Conventional Bank | 3% | 11% | 4% | 10% | 28% | ||
| Conventional Bank with Islamic activities | 10% | 10% | 19% | ||||
| Fully Fledged Islamic Bank | 7% | 13% | 3% | 7% | 6% | 35% | |
| Law Firm | 3% | 3% | |||||
| Rating Agency | 7% | 7% | |||||
| Sharia'a Scholar | 1% | 1% | |||||
| Total | 3% | 43% | 26% | 3% | 19% | 6% | 100% |
Since the operational nature of the participating institutions has implications for some of the questions in the questionnaire, the nature of activities of the financial institutions is also examined. As depicted in Table 7.4, respondents are almost equally distributed among retail banking (14%), commercial banking (15%) and investment banking (15%). Twenty-four percent of respondents stated that their institutions offer both retail and commercial banking, while 14% considered their institution an integrated bank or private equity house. The ‘Other’ category (18%) comprises of audit, consulting and law firms, together with rating agencies and Shari'ah scholars.
TABLE 7.4 Activities of financial institution
| Conventional Bank | Conventional Bank with Islamic activities | Fully Fledged Islamic Bank | Others | Total | |
| Commercial banking | 4% | 7% | 4% | 15% | |
| Integrated banking | 8% | 4% | 13% | ||
| Investment banking | 6% | 3% | 7% | 15% | |
| Private Equity House | 1% | 1% | |||
| Retail & commercial banking | 10% | 3% | 11% | 24% | |
| Retail banking | 3% | 11% | 14% | ||
| Other | 18% | 18% | |||
| Total | 28% | 19% | 35% | 18% | 100% |
Finally, the accounting standards utilised by the sampled financial institutions were also asked about in the questionnaire. As illustrated in Figure 7.1, the majority of the participating banks use international accounting standards (53%), 8.3% use AAOIFI standards, 13.9% use local accounting standards, while 6.9% of respondents said their institutions adapt both AAOIFI and international standards concurrently. Eighteen percent of respondents fall under the ‘Not Applicable’ category as these respondents are not working for financial institutions.

FIGURE 7.1 Accounting standards used by financial institution
Locating Risk Perception
Perceptions of risk issues in Islamic banks
Overall risks faced by Islamic banks Respondents were asked in Question 7 to express their perceptions of the severity of risks facing Islamic financial institutions (IFIs) by indicating the degree of importance of each risk on a five-point Likert scale (ranking from Very Unimportant = 1 to Very Important = 5). In addition, Question 8, being an open-ended question, requested respondents to list any additional risk(s) – in order of seriousness – that could affect IFIs.
The descriptive statistics in Table 7.5 demonstrate the importance attached to each of the risk areas by the participants as faced by their financial institution. As can be seen from Table 7.5, the mean values for the risk categories are between 4.01 and 2.72, the median is between 4 and 2, and the mode is between 5 and 2. However, due to the nature of the data collected using a Likert scale, the median and the mode seem to be more appropriate measurements for this study. According to Howell (1997), the major advantage of the median and the mode is that unlike the mean, they are unaffected by extreme scores. Another advantage of these measures, when contrasted with the mean, is that they do not require any assumptions about the interval properties of the scale.
TABLE 7.5 Descriptive statistics for each type of risk (aggregate results)
| Risk | n | Mean | Median | Mode | Chi-Square |
| Liquidity Risk | 72 | 4.01 | 4 | 5 | 0.000 |
| Asset-Liability Management Risk | 72 | 3.94 | 4 | 5 | 0.000 |
| Reputation Risk | 72 | 3.92 | 4 | 5 | 0.000 |
| Concentration Risk | 72 | 3.81 | 4 | 5 | 0.000 |
| Credit Risk | 72 | 3.75 | 4 | 4 | 0.000 |
| Shari'ah- Non-Compliance Risk | 72 | 3.71 | 4 | 3 | 0.000 |
| Legal Risk | 72 | 3.49 | 3 | 3 | 0.000 |
| Corporate Governance Risk | 72 | 3.21 | 3 | 2 | 0.108 N/S |
| Displaced Commercial Risk | 69 | 2.94 | 3 | 4 | 0.160 N/S |
| Operational Risk | 72 | 2.93 | 3 | 3 | 0.000 |
| Equity Investment Risk | 72 | 2.86 | 3 | 3 | 0.046 |
| Fiduciary Risk | 70 | 2.74 | 3 | 2 | 0.004 |
| Market Risk | 71 | 2.72 | 2 | 2 | 0.002 |
Notes: n = Number of responses; N/S indicates that the differences between the responses are not significant at 5% using the Chi-Square test of significance
Furthermore, the Chi-Square test, a non-parametric test, is used to explore frequency data in order to test whether the data represents good fit or not. This study uses a significance level of 5%. Since, for this question, for most risks (except displaced commercial risk and corporate governance risk) the p-value is less than 0.05, it is concluded that for most risks there is goodness of fit between the data.
On an aggregate level, as can be seen from Table 7.5, liquidity risk is perceived as the most severe risk facing IFIs with the highest mean value of 4.01 followed by asset–liability management (ALM) risk (3.94) and reputation risk (3.92). Concentration, credit and Shari'ah-non-compliance risks followed the initial risk categories but were not recognised as being as critical as the top risks by the participants. Among the risks listed, market risk was considered as the least risky (2.72).
It is no surprise that liquidity and ALM risks are ranked as the highest risks facing the industry. The limited range of possible funding sources for IFIs and the consistent focus on longer-term assets lead to concentrated liabilities, imbalanced funding mixes and stretched capital management strategies. The two risks are closely correlated and the impact of liquidity risk is magnified by the lack of money-market instruments to manage liquidity. These two risks, together with reputation and concentration risks, support Research Hypothesis 1 about the top risks facing IFIs.
Shari'ah-non-compliance risk has been ranked sixth as it is likely to be a significant and unique risk for IFIs, since Shari'ah-compliance should be the core focus of every IFI. Any divergence from Shari'ah principles exposes the IFI to a wide range of risks at different levels as discussed in previous chapters.
Operational risk has been ranked tenth by respondents; this is not in line with the researcher's expectations as operational risk could be critical to IFIs due to their specific contractual features. In addition, because of the relatively new nature of Islamic banking, a lot of the issues related to operations need to be instituted. These include people risk, creating computer programmes and legal documents, etc. It should be noted that Research Hypothesis 1 does not consider operational risk to be among the top five risks; however, a higher ranking was expected.
Market risk (incorporating rate-of-return risk, currency risk, commodity risk, benchmark risk and mark-up risk) is incurred on instruments like commodities and currencies traded in well-traded markets; this appears to be less risky for Islamic banks. This risk arises from movements in the prices of goods/securities which are usually a part of the trading book of a bank. On the banking book, conventional banks trade in currencies, indices and bonds to boost their profitability and to keep a part of their assets in liquid money-market instruments. Market risk tends to be more speculative in nature. However, the majority of Shari'ah scholars forbid the sale of debt, and trading in sukuk is almost non-existent among IFIs as most of them hold the sukuk until maturity. Islamic banks, however, can trade in commodities and asset-backed securities; however, not too many IFIs are involved in this, and this may be a reason for the low ranking of market risk.
Equity investment risk was intentionally separated from market risk in the questionnaire as profit and loss sharing (PLS) through musharakah and mudarabah contracts should be the essence of Islamic banking. Unfortunately, IFIs in practice tend to allocate limited funds to equities and therefore equity investment risk was ranked among the lowest risks recognised by bankers. As more IFIs shift their strategic attention to equities after the drying up of international money markets and the attractive equity investment opportunities emerging following the recent crisis, equity investment risk is expected to attract more attention in the Islamic banking world.
Of note is the low rank given to displaced commercial risk, as the practice of smoothing investment returns through Profit Equalisation Reserves (PERs), Investment Risk Reserves (IRRs) and active management of mudarib fees is a very common feature of IFIs to avoid random, business and confidence-driven liquidity crises. In addition, it was observed that some respondents did not understand what is meant by displaced commercial risk, despite its being defined in the questionnaire. This was reflected in the relatively lower number of responses for this risk category (69) compared to the others.
In order to examine the risk perceptions further, Table 7.6 breaks down the risk perceptions according to the nature of the financial institutions: Islamic banks, conventional banks (including those offering Islamic activities) and Others. For each category of financial institution, the mean ranking of risk categories are presented.
TABLE 7.6 Risk perception among different groups
| Islamic Banks | Conventional Banks | Others | |||
| Risk | Mean | Risk | Mean | Risk | Mean |
| Liquidity Risk | 4.48 | Liquidity Risk | 3.79 | Reputation Risk | 4.23 |
| ALM Risk | 4.44 | Credit Risk | 3.62 | Shari'ah-Non-Compliance Risk | 4.00 |
| Reputation Risk | 4.44 | ALM Risk | 3.62 | ALM Risk | 3.85 |
| Concentration Risk | 4.36 | Concentration Risk | 3.47 | Credit Risk | 3.69 |
| Shari'ah-Non-Compliance Risk | 4.24 | Legal Risk | 3.47 | Liquidity Risk | 3.69 |
| Credit Risk | 3.96 | Reputation Risk | 3.41 | Concentration Risk | 3.62 |
| Legal Risk | 3.56 | Corporate Governance Risk | 3.29 | Market Risk | 3.54 |
| Equity Investment Risk | 3.16 | Shari'ah-Non-Compliance Risk | 3.21 | Corporate Governance Risk | 3.46 |
| Operational Risk | 3.00 | Displaced Commercial Risk | 3.18 | Legal Risk | 3.38 |
| Corporate Governance Risk | 2.96 | Operational Risk | 2.85 | Operational Risk | 3.00 |
| Fiduciary Risk | 2.79 | Fiduciary Risk | 2.71 | Equity Investment Risk | 2.92 |
| Displaced Commercial Risk | 2.76 | Equity Investment Risk | 2.62 | Fiduciary Risk | 2.75 |
| Market Risk | 2.48 | Market Risk | 2.58 | Displaced Commercial Risk | 2.64 |
Note: Conventional banks include Islamic subsidiaries
The results depicted in Table 7.6 can be summarised as follows:
- The top four risks identified by Islamic bankers are the same top four risks ranked by the total sample in aggregate (see Table 7.5).
- Three out of the top four risks identified by Islamic bankers are also listed by conventional bankers among the top four risks.
- Only two out of the top four risks identified by Islamic bankers are among the top four risks ranked by Others; these are reputation and ALM risks.
- Different patterns exist for the last four risk categories; however, no trends could be identified.
- Islamic bankers' risk perception of corporate governance risk (2.96) is noticeably lower than the risk perception of conventional bankers (3.29) and Others (3.46). This is contrary to the literature review, which indicates that weak corporate governance structure is a general feature of Islamic banking. Also, the inferential statistics analysis in Chapter 8 proves that corporate governance is the most statistically significant risk facing IFIs across a number of control variables. In fact, corporate governance is a significant risk facing IFIs. However, the Islamic bankers included in this sample are mainly from the Middle East and the GCC, and their risk perceptions are influenced by cultural and social aspects.
It should also be noted that the results in Table 7.6 indicate that bankers, whether Islamic or non-Islamic, have a better understanding of the Islamic banking model and its risk architecture than non-bankers (Others), who tend to be more theoretical in their approach.
In supporting the findings in Table 7.6, Table 7.7 spreads the responses of each group across the five scaling criteria through frequency distribution. This provides a better understanding of the risk perception of each group and helps to reach significant findings.
TABLE 7.7 Frequency distribution of risk perceptions
| Islamic Banks | Conventional Banks | Others | |||||||||||||
| Risk | VI | I | N | U | VU | VI | I | N | U | VU | VI | I | N | U | VU |
| Credit Risk | 20% | 60% | 16% | 4% | 0% | 18% | 38% | 35% | 6% | 3% | 23% | 31% | 38% | 8% | 0% |
| Market Risk | 8% | 24% | 8% | 28% | 32% | 6% | 12% | 21% | 55% | 6% | 23% | 38% | 15% | 15% | 8% |
| Operational Risk | 8% | 20% | 44% | 20% | 8% | 3% | 29% | 26% | 32% | 9% | 8% | 31% | 23% | 31% | 8% |
| Equity Investment Risk | 16% | 24% | 36% | 8% | 16% | 9% | 18% | 26% | 21% | 26% | 8% | 15% | 46% | 23% | 8% |
| Liquidity Risk | 64% | 24% | 8% | 4% | 0% | 35% | 26% | 24% | 12% | 3% | 38% | 23% | 15% | 15% | 8% |
| ALM Risk | 60% | 28% | 8% | 4% | 0% | 29% | 26% | 24% | 18% | 3% | 38% | 31% | 15% | 8% | 8% |
| Displaced Commercial Risk | 8% | 20% | 36% | 12% | 24% | 15% | 39% | 12% | 15% | 18% | 9% | 18% | 27% | 18% | 27% |
| Shari'ah-Non-Compliance Risk | 44% | 36% | 20% | 0% | 0% | 15% | 18% | 41% | 26% | 0% | 38% | 23% | 38% | 0% | 0% |
| Concentration Risk | 52% | 36% | 8% | 4% | 0% | 26% | 24% | 26% | 18% | 6% | 23% | 23% | 46% | 8% | 0% |
| Reputation Risk | 52% | 40% | 8% | 0% | 0% | 26% | 26% | 18% | 21% | 9% | 46% | 38% | 8% | 8% | 0% |
| Fiduciary Risk | 8% | 17% | 33% | 29% | 13% | 18% | 6% | 24% | 35% | 18% | 8% | 8% | 42% | 33% | 8% |
| Corporate Governance Risk | 12% | 20% | 32% | 24% | 12% | 24% | 26% | 12% | 32% | 6% | 31% | 23% | 15% | 23% | 8% |
| Legal Risk | 16% | 44% | 24% | 12% | 4% | 26% | 12% | 44% | 18% | 0% | 15% | 23% | 46% | 15% | 0% |
Note 1: Scale: 1 = Very Unimportant (VU), 2 = Unimportant (U), 3 = Neutral (N), 4 = Important (I), 5 = Very Important (VI)
Note 2: Conventional banks include Islamic subsidiaries
As depicted by the frequency distribution in Table 7.7, there is similarity in risk perceptions between Islamic and conventional bankers. This will be further emphasised by the results of the Kruskall-Wallis test of significance in Chapter 8, which proves that there is a general trend in terms of risk perception that can be attributed to prevailing market conditions.
Finally, under open-ended Question 8, two respondents added political and country risks as additional risks facing IFIs. Most Muslim countries have a high degree of corruption, political instability and weak currencies, which add political and country risks for IFIs. However, the lesson from the recent political unrest and revolutions in the Middle East is that political risk indeed matters and remains an important risk category area considering the volatility of the political circumstances. However, as an Islamic finance risk category, this was largely ignored. It should be also acknowledged that political risks are hard to predict and are not recurring. However, considering the recent and current political developments in the Middle East, if the questionnaire is to be administered now, namely after the eruption of the Middle Eastern revolutions, political risk would most likely attract much higher scores given that most Islamic banks are located in, or directly affected by, Middle Eastern events, with the Middle East being the main liquidity source for IFIs. Lastly, in locating the risk categories for the IFI, one respondent mentioned regulatory risk, and another added technical risks.
Perceived risk levels of Islamic finance contracts The questionnaire also aims at locating the perceptions and opinions of the respondents on various Islamic modes of financing. While Question 9 covers the intensity of use of different Islamic finance contracts, Question 10 searches for feedback on the risks inherent or perceived to be attached in those contracts. Question 9 is applicable only to IFIs and conventional banks with Islamic activities, while such restriction does not hold for Question 10.
(i) Intensity of use of different Islamic financial contracts Table 7.8 summarises the mean values of Islamic finance contracts. As expected, murabahah contracts are by far the most-used contracts. This ‘murabahah syndrome’ has been under criticism from many Islamic economists and some Shari'ah scholars, but unfortunately still remains the backbone of Islamic banking and finance (IBF). In addition to the findings in this study, other studies in the literature also demonstrate that murabahah has been intensively used by IFIs for money-market transactions, investment and retail activities. Recently, more banks began using walaka for money-market transactions to replace the commodity murabahah, which brings about more complications and raises Shari'ah concerns.
TABLE 7.8 Intensity of use of Islamic finance contracts
| Risk | n | Mean | Median | Mode | Chi-Square |
| Murabaha | 39 | 6.95 | 1 | 1 | 0.00 |
| Wakala | 39 | 5.56 | 2 | 2 | 0.00 |
| Ijarah | 39 | 4.28 | 4 | 4 | 0.00 |
| Mudaraba | 39 | 4.00 | 4 | 4 | 0.01 |
| Istisna'a | 39 | 2.46 | 6 | 6 | 0.00 |
| Musharaka | 39 | 2.41 | 6 | 5 | 0.00 |
| Salaam | 39 | 2.33 | 6 | 7 | 0.00 |
Notes: n = Number of responses; Question 9 is applicable only to IFIs and conventional banks with Islamic activities
The low mean values for musharakah and mudarabah in Table 7.8 reflect Islamic banks' reluctance to hold risk-sharing assets. In addition, the analysis revealed that salam has a long way to go before becoming commonly used by Islamic banks. It is evident from the responses that the banks' first preference is for financial instruments that are generated through debt-creating, sale contracts and leasing instruments. This is enhanced by the responses about risk perception in different modes of financing.
These findings are supported by the results of the Chi-Square test as reported in Table 7.8, which indicated that the Chi-Square values related to the goodness of fit of the risk categories are highly significant (p < 1%).
In addition, as depicted in Table 7.9, Spearman's Rank Correlation Coefficient between the medians of Islamic banks and conventional banks offering Islamic products shows that at 5% significance level the rankings of the two groups are correlated (ρ = 0.9420 > 0.714).
TABLE 7.9 Correlation between Islamic and conventional banks in using Islamic finance contracts
| Islamic Banks Median | Conventional Banks Median | Difference | (Difference) 2 | |
| Murabaha | 1 | 1 | 0 | 0 |
| Wakala | 2 | 2.5 | 0.5 | 0.25 |
| Mudaraba | 4 | 3 | −1 | 1 |
| Ijarah | 4 | 4 | 0 | 0 |
| Musharaka | 5 | 6 | 1 | 1 |
| Istisna'a | 6 | 6 | 0 | 0 |
| Salam | 6 | 5 | −1 | 1 |
| Spearman's Rank Correlation Coefficient | 0.94196 | |||
(ii) Perceptions of risks attached to various Islamic finance contracts Table 7.10 emphasises the perception that the profit-sharing modes of financing have higher risks, while fixed-income contracts (such as ijara and murabahah) are perceived as least risky. The main reason for higher concern regarding partnership contracts may be that ‘principals’ invested are not guaranteed under partnership modes of finance. In addition, these instruments are usually of a long-term nature. This is particularly true for real estate projects, while fixed-income contracts are perceived to have shorter maturities and to be less risky, with some ‘implied’ guarantees. Even though ijarah contracts may be long term, they can be adjusted to reflect changing market conditions. It is important to note that the manipulation of the contracts by Islamic finance practitioners resulted in the equity and risk-sharing contracts, for instance wakala, sharing the same risk characteristics as fixed-income contracts. This created a gap in risk perceptions among different groups of respondents. These findings are supported by the results of the Chi-Square test, which indicate the presence of goodness of fit for the financial contracts with high significance level (p < 1%).
TABLE 7.10 Risk perception in Islamic finance contracts
| Risk | n | Mean | Median | Mode | Chi-Square |
| Mudaraba | 72 | 6.21 | 1 | 1 | 0.00 |
| Musharaka | 72 | 5.89 | 2 | 1 | 0.00 |
| Istisna'a | 70 | 4.20 | 3.5 | 3 | 0.00 |
| Salaam | 71 | 3.75 | 4 | 5 | 0.00 |
| Ijarah | 71 | 3.73 | 4 | 2 | 0.01 |
| Wakala | 72 | 2.26 | 6 | 6 | 0.00 |
| Murabaha | 72 | 1.90 | 7 | 7 | 0.00 |
Notes: n = Number of responses
In addition, as shown in Table 7.11, Spearman's Rank Correlation Coefficient between the medians of Islamic banks and conventional banks offering Islamic products shows that at 5% significance level the rankings of the two groups are correlated (ρ = 0.8929 > 0.714).
TABLE 7.11 Correlation between Islamic and conventional banks in risk perception about Islamic finance contracts
| Islamic Banks Median | Conventional Banks Median | Difference | (Difference)2 | |
| Murabaha | 7 | 7 | 0 | 0 |
| Mudaraba | 1 | 1 | 0 | 1 |
| Wakala | 6 | 6 | 0 | 1 |
| Ijarah | 4 | 4 | 0 | 1 |
| Musharaka | 2 | 2 | 0 | 1 |
| Istisna'a | 3 | 4 | 1 | 1 |
| Salam | 4 | 4 | 0 | 1 |
| Spearman's Rank Correlation Coefficient | 0.89286 | |||
In furthering the analysis, intensity of use of Islamic finance contracts were correlated with the attached risk perceptions regarding the respective financial contracts. This is depicted in Figure 7.2, which demonstrates that Islamic finance contracts that are perceived as higher risk (like mudarabah and musharakah) are much less used by banks than less risky contracts. In fact, murabahah scored the lowest mean on the risk matrix (1.90) compared to the highest mean on the intensity of use (6.95). This reflects the extent to which banks are shying away from risk-taking or equity participation. Manipulation of the contracts changed the risk characteristics of these contracts from principles defined by Islamic finance. This manipulation caused the Islamic finance contracts to behave differently and thus they are perceived differently by practitioners on the risk scale. Thus, the FIs are heavily using less risky products regardless of the aspirational expectations related to asset-based Islamic finance.

FIGURE 7.2 Islamic finance contracts: Intensity of use versus risk perception
Additional risk issues facing IFIs Question 11 asked respondents for their views on some risk and risk management issues related to IFIs that were identified in the literature review. This is a closed question that provided 11 statements and respondents were requested to express their preference in terms of how strongly they agreed or disagreed with each statement. The five-point Likert scale was used with answers labelled ‘strongly agree’, ‘agree’, neutral', ‘disagree’ and ‘strongly disagree’. The findings based on frequency results are summarised in Figure 7.3 and Table 7.12, which ranks the importance of statements according to their mean values.

FIGURE 7.3 Additional risk management issues facing IFIs
TABLE 7.12 Frequency results of responses to statements under Question 11
| Statement | SA | A | N | D | SD | n | Mean | Median | Mode | Chi-Square |
| Non-Sharia'a compliance could severely damage the reputation of an Islamic bank | 41.7% | 44.4% | 8.3% | 5.6% | 0.0% | 72 | 4.22 | 4 | 4 | 0.00 |
| Risk management for Islamic banks is more challenging than it is for conventional banks | 22.2% | 43.1% | 22.2% | 12.5% | 0.0% | 72 | 3.75 | 4 | 4 | 0.00 |
| Variation among Sharia'a scholars' opinions represent a major risk to Islamic banking | 23.6% | 36.1% | 26.4% | 9.7% | 4.2% | 72 | 3.65 | 4 | 4 | 0.00 |
| AAOIFI and IFSB standards should be made mandatory on Islamic banks | 18.1% | 15.3% | 23.6% | 40.3% | 2.8% | 72 | 3.51 | 4 | 4 | 0.44 |
| Depositors would hold the bank responsible for a lower rate of return on their deposits | 12.5% | 41.7% | 27.8% | 18.1% | 0.0% | 72 | 3.49 | 4 | 4 | 0.00 |
| In an Islamic bank, a low rate of return on deposits will lead to withdrawal of funds | 9.7% | 34.7% | 27.8% | 27.8% | 0.0% | 72 | 3.26 | 3 | 4 | 0.00 |
| There is naturally inherent conservatism in the principles of Islamic finance | 8.3% | 40.3% | 23.6% | 23.6% | 4.2% | 72 | 3.25 | 3 | 4 | 0.00 |
| Corporate governance is generally weak in Islamic banks | 8.3% | 40.3% | 23.6% | 22.2% | 5.6% | 72 | 3.24 | 3 | 4 | 0.00 |
| Islamic banking is more risky by nature than conventional banking | 8.3% | 30.6% | 12.5% | 31.9% | 16.7% | 72 | 2.82 | 3 | 2 | 0.00 |
| Risks for Islamic banks should be managed using same techniques used in conventional banking | 9.7% | 15.3% | 18.1% | 34.7% | 22.2% | 72 | 2.56 | 2 | 2 | 0.01 |
| Islamic banking in its current state is a safer option than conventional banking | 4.2% | 4.2% | 16.7% | 51.4% | 23.6% | 72 | 2.14 | 2 | 2 | 0.00 |
Notes: n = Number of responses; Scale: 1 = Strongly Disagree (SD), 2 = Disagree (D), 3 = Neutral (N), 4 = Agree (A), 5 = Strongly Agree (SA)
As can be seen in Table 7.12, the Chi-Square values indicate that the responses for all these statements but one are significant at the 5% level. Furthermore, the findings indicate that the majority of respondents (56.9%) believe that risk for Islamic banks should be managed using different techniques than those used in conventional banking. Although more than 48% of respondents consider that the Islamic finance principles contain naturally built-in conservatism, around 75% of respondents think that the malpractices in Islamic banking in its current state made it a riskier mode of finance than conventional banking.
The following salient points are identified in Table 7.12 and Figure 7.3:
- The findings demonstrate that, although respondents do not perceive Islamic banking to be by nature a more risky model than conventional banking, Islamic banks as they stand today could be more risky than conventional banks.
- As the findings show, risk management for IFIs is more challenging than it is for conventional banks.
- The findings indicate that risks for IFIs cannot be managed using conventional risk management tools and techniques.
- The findings in Table 7.12 and Figure 7.3. show that not only do IFIs face some risks that are different from those faced by their conventional peers, but these risks are also more serious and not well understood.
- It can be generalised from the findings that Shari'ah principles carry natural inherent conservatism.
- It is important to state that despite the principles of Islamic finance, depositors seek competitive rates of return from IFIs.
- In addition to the risk categories identified in the previous section, displaced commercial risk and Shari'ah standardisation are obvious examples of additional challenges facing IFIs.
- As a particular risk area for Islamic banking, the Shari'ah-non-compliance risk could be a severe risk for IFIs. This is emphasised by the responses under Question 7.
- As the findings demonstrate, the majority of respondents do not believe that AAOIFI and IFSB standards should be made mandatory for Islamic banks.
- Importantly, the results also demonstrate that weak corporate governance is noticeable among IFIs.
Gauging perceptions of capital adequacy for Islamic banks This section addresses capital adequacy issues facing IFIs as perceived by the participants. It tackles the research questions concerning whether the Basel II and Basel III Accords were drafted with the conventional banking model in mind, and also aims to identify the appropriate capital requirement levels for Islamic banks as perceived by the participants.
As shown by Figure 7.4, the majority of respondents (59.7%) expressed their adherence to the Basel II guidelines. Interestingly, 12.9% of the participants stated that their institution used IFSB standards on capital adequacy, and 6.9% stated that they used local standards imposed by the regulator (mainly Egyptian banks), which are highly likely to be derived mainly from Basel II guidelines.

FIGURE 7.4 Frequency distribution of capital adequacy standards used by respondents
Among those implementing Basel II (43 respondents), the majority of the participants stated that their institution used the less sophisticated approaches to calculate credit, market and operational risks due to their relatively limited size of operations and the absence of advanced IT systems, as summarised in Table 7.13. Conventional multinational banks use a combination of different approaches for different portfolios; however, the ‘Advanced’ techniques dominate. As the findings demonstrate, among IFIs, it is mainly the Islamic windows of big international banks that selected the ‘Advanced’ capital adequacy approaches as they make use of the infrastructure and systems available at their parent companies.
TABLE 7.13 Descriptive statistics for Question 13: Capital requirement methodologies used
| n | Percentage of Total | |
| Credit Risk | ||
| Standardised Approach | 25 | 59.5% |
| Foundation IRB | 5 | 11.9% |
| Advanced IRB | 12 | 28.6% |
| Total | 42 | 100.0% |
| Market Risk | ||
| Standardised Approach | 29 | 69.0% |
| Internal Models Approach | 13 | 31.0% |
| Total | 42 | 100.0% |
| Operational Risk | ||
| Basic Indicator Approach | 24 | 57.1% |
| Advanced Measurement Approach | 18 | 42.9% |
| Total | 42 | 100.0% |
Notes: n = Number of responses; for multinational banks that use more than one methodology, the most advanced methodology is the one counted
The participants were asked to evaluate the capital requirements for Islamic and conventional banks. The responses to Question 14 in Figure 7.5 and Table 7.14 produced unexpected findings, as more than 65% of participants believe that capital requirements for IFIs should be higher than those for their conventional peers. This could be understood as meaning, as things stand today, that Islamic banking carries more risks and hence should have higher capital buffers in order to enable IFIs absorb unexpected losses.

FIGURE 7.5 Evaluating capital requirements for Islamic banks versus conventional banks
TABLE 7.14 Evaluating capital requirements for Islamic banks versus conventional banks
| Region | Fully Fledged Islamic Bank | Conventional Bank | Conventional Bank with Islamic Activities | Others | Total | |
| Don't know | Europe | 1.4% | 2.8% | 4.2% | ||
| GCC | 1.4% | 1.4% | 0.0% | 2.8% | ||
| Higher | Americas | 2.8% | 0.0% | 2.8% | ||
| Europe | 5.6% | 11.1% | 6.9% | 11.1% | 34.7% | |
| GCC | 2.8% | 2.8% | 8.3% | 0.0% | 13.9% | |
| Other Middle East | 1.4% | 9.7% | 1.4% | 12.5% | ||
| Southeast Asia | 1.4% | 0.0% | 1.4% | |||
| Lower | Europe | 1.4% | 1.4% | |||
| GCC | 2.8% | 0.0% | 2.8% | |||
| Other | 1.4% | 0.0% | 1.4% | |||
| Other Middle East | 1.4% | 1.4% | 2.8% | |||
| Southeast Asia | 1.4% | 0.0% | 1.4% | |||
| Same | Europe | 1.4% | 1.4% | 0.0% | 2.8% | |
| GCC | 6.9% | 0.0% | 6.9% | |||
| Other | 1.4% | 0.0% | 1.4% | |||
| Other Middle East | 4.2% | 0.0% | 4.2% | |||
| Southeast Asia | 2.8% | 0.0% | 2.8% | |||
| Total | 34.7% | 27.8% | 19.4% | 18.1% | 100% |
The participants' opinions on Basel II and IFSB Capital Adequacy Standards were also requested, as Question 15 of the questionnaire asked respondents for their views on additional capital adequacy issues. This closed question provided five statements, and respondents were requested to express their preference in terms of how strongly they agree or disagree with each statement. The results, using the five-point Likert scale, are summarised below. The frequency results for the whole sample are summarised by Figure 7.6, while Table 7.15, which breaks down the findings for Islamic bankers and non-Islamic bankers (including Islamic subsidiaries, conventional banks and others), ranks the importance of statements according to their mean values.

FIGURE 7.6 Perceptions about capital adequacy standards
TABLE 7.15 Breakdown of perceptions of capital adequacy standards
| Fully Fledged Islamic Banks | ||||||||||
| Statement | SA | A | N | D | SD | n | Mean | Median | Mode | Chi-Square |
| Basel II standards should be reviewed after failing to prevent the current crisis | 40.0% | 48.0% | 12.0% | 0.0% | 0.0% | 25 | 4.28 | 4 | 4 | 0.00 |
| IFSB standard on Capital Adequacy should be used by Islamic banks rather than Basel II | 24.0% | 12.0% | 44.0% | 16.0% | 4.0% | 25 | 3.36 | 3 | 3 | 0.02 |
| Stricter capital, leverage, and liquidity rules, as proposed under Basel III, are likely to prevent another financial crisis. | 4.0% | 20.0% | 48.0% | 24.0% | 4.0% | 25 | 2.96 | 3 | 3 | 0.00 |
| Basel II standards should be equally applied to Islamic banks without modification | 4.0% | 32.0% | 20.0% | 32.0% | 12.0% | 25 | 2.84 | 3 | 2 | 0.11 |
| The proposed Basel III rules would be easily applicable to Islamic banks | 0.0% | 8.0% | 48.0% | 36.0% | 8.0% | 25 | 2.56 | 3 | 3 | 0.00 |
| Non-Islamic Bankers (including Islamic subsidiaries and conventional banks) | ||||||||||
| Statement | SA | A | N | D | SD | n | Mean | Median | Mode | Chi-square |
| Basel II standards should be reviewed after failing to prevent the current crisis | 36.2% | 51.1% | 12.8% | 0.0% | 0.0% | 47 | 4.23 | 4 | 4 | 0.00 |
| Basel II standards should be equally applied to Islamic banks without modification | 21.3% | 25.5% | 25.5% | 23.4% | 4.3% | 47 | 3.36 | 3 | 3 | 0.11 |
| IFSB standard on Capital Adequacy should be used by Islamic banks rather than Basel II | 21.3% | 14.9% | 36.2% | 21.3% | 6.4% | 47 | 3.23 | 3 | 3 | 0.02 |
| The proposed Basel III rules would be easily applicable to Islamic banks | 0.0% | 6.4% | 74.5% | 10.6% | 8.5% | 47 | 2.79 | 3 | 3 | 0.00 |
| Stricter capital, leverage and liquidity rules, as proposed under Basel III, are likely to prevent another financial crisis. | 2.1% | 6.4% | 57.4% | 31.9% | 2.1% | 47 | 2.74 | 3 | 3 | 0.00 |
Notes: n = Number of responses; Scale: 1 = Strongly Disagree (SD), 2 = Disagree (D), 3 = Neutral (N), 4 = Agree (A), 5 = Strongly Agree (SA)
From Table 7.15 and Figure 7.6, the following generalisation can be made:
- On aggregate level, the majority of respondents had ‘No’ views about the new Basel III standards and their effects on Islamic banking and financial stability in general. This shows that there is still lack of clarity about Basel III and its potential impacts. Around one-third of respondents do not believe that the new standards, with their stricter capital, leverage and liquidity rules, are likely to prevent another financial crisis. Almost the same percentage of respondents do not think that the Basel III standards will be easily applicable to IFIs. The breakdown between Islamic and non-Islamic bankers reveals the same pattern.
- A similar pattern exists between the two groups regarding their views about the failings of Basel II to prevent the recent crisis. The majority of respondents support this view, with zero responding ‘D’ or ‘SD’ on the need to review Basel II standards.
- While most non-Islamic bankers (46.8%) believe that Basel II standards should be equally applied to IFIs without modification, most Islamic bankers support the opposite (44%). On aggregate level no consensus pattern is obvious, with the ‘SA’ and ‘A’ side scoring slightly higher than the ‘D’ and ‘SD’ side.
- A similar pattern exists between the views of the two groups regarding the use of the IFSB standards by IFIs with the majority favouring the ‘SA’ and ‘A’ side over the ‘D’ and ‘SD’ side.
- As shown in Table 7.15, Islamic and non-Islamic bankers rank the statements differently. This divergence in the mean rankings reflects differences in risk perceptions.
It should be noted that these findings are supported by the Chi-Square values as depicted in Table 7.15, which indicate that the data for all statements but one represent a good fit at the 5% level.
The credit crisis and Islamic banks This last section of Part Two of the questionnaire aimed to reveal the respondents' views on different issues relating to the global crisis. This closed question provided nine statements and respondents were requested to express their opinion in terms of how strongly they agree or disagree with each statement. The frequency results for the entire sample are summarised by Figure 7.7, while Table 7.16 breaks down the findings for Islamic bankers and non-Islamic bankers (including Islamic subsidiaries, conventional banks and others), and ranks the importance of statements according to their mean values.

FIGURE 7.7 Perceptions of Islamic banking and the global financial crisis
TABLE 7.16 Perceptions of Islamic banking and the financial crisis
| Total Sample | ||||||||||
| Statement | SA | A | N | D | SD | n | Mean | Median | Mode | Chi-Square |
| Risk management must be embedded institutionally | 48.6% | 30.6% | 20.8% | 0.0% | 0.0% | 72 | 4.28 | 4 | 5 | 0.00 |
| Consolidation is needed among smaller Islamic banks | 43.1% | 26.4% | 27.8% | 2.8% | 0.0% | 72 | 4.10 | 4 | 5 | 0.00 |
| Banks in general used to rely heavily on rating agencies | 26.4% | 30.6% | 34.7% | 5.6% | 2.8% | 72 | 3.72 | 4 | 3 | 0.00 |
| The recent crisis would not have happened under a true Islamic banking system | 25.0% | 41.7% | 16.7% | 11.1% | 5.6% | 72 | 3.69 | 4 | 4 | 0.00 |
| Islamic banks will emerge stronger from the current crisis | 15.3% | 50.0% | 19.4% | 9.7% | 5.6% | 72 | 3.60 | 4 | 4 | 0.00 |
| Islamic banks are more resilient to economic shocks than their conventional peers | 25.0% | 26.4% | 26.4% | 16.7% | 5.6% | 72 | 3.49 | 4 | 4 | 0.00 |
| Islamic banks rely less on rating agencies than conventional banks | 8.3% | 25.0% | 43.1% | 20.8% | 2.8% | 72 | 3.15 | 3 | 3 | 0.00 |
| Islamic finance could have solved the global crisis | 9.7% | 25.0% | 37.5% | 18.1% | 9.7% | 72 | 3.07 | 3 | 3 | 0.00 |
| Islamic finance industry should develop its own rating agencies | 12.5% | 20.8% | 29.2% | 23.6% | 13.9% | 72 | 2.94 | 3 | 3 | 0.00 |
| Fully Fledged Islamic Banks | ||||||||||
| Statement | SA | A | N | D | SD | n | Mean | Median | Mode | Chi-Square |
| Risk management must be embedded institutionally | 32.0% | 40.0% | 28.0% | 0.0% | 0.0% | 25 | 4.04 | 4 | 4 | 0.00 |
| Banks in general used to rely heavily on rating agencies | 28.0% | 48.0% | 20.0% | 4.0% | 0.0% | 25 | 4.00 | 4 | 4 | 0.00 |
| Islamic banks are more resilient to economic shocks than their conventional peers | 40.0% | 32.0% | 8.0% | 20.0% | 0.0% | 25 | 3.92 | 4 | 5 | 0.01 |
| The recent crisis would not have happened under a true Islamic banking system | 20.0% | 56.0% | 16.0% | 8.0% | 0.0% | 25 | 3.88 | 4 | 4 | 0.00 |
| Consolidation is needed among smaller Islamic banks | 28.0% | 36.0% | 32.0% | 4.0% | 0.0% | 25 | 3.88 | 4 | 4 | 0.01 |
| Islamic banks will emerge stronger from the current crisis | 24.0% | 32.0 | 36.0% | 8.0% | 0.0% | 25 | 3.72 | 4 | 3 | 0.02 |
| Islamic finance can solve the global crisis | 16.0% | 40.0% | 32.0% | 12.0% | 0.0% | 25 | 3.60 | 4 | 4 | 0.01 |
| Islamic banks rely less on rating agencies than conventional banks | 12.0% | 20.0% | 24.0% | 36.0% | 8.0% | 25 | 2.92 | 3 | 2 | 0.20 |
| Islamic finance industry should develop its own rating agencies | 20.0% | 12.0% | 24.0% | 28.0% | 16.0% | 25 | 2.92 | 3 | 2 | 0.74 |
| Non-Islamic Bankers (including Islamic subsidiaries, conventional banks and others) | ||||||||||
| Statement | SA | A | N | D | SD | n | Mean | Median | Mode | Chi-Square |
| Risk management must be embedded institutionally | 57.4% | 25.5% | 17.0% | 0.0% | 0.0% | 47 | 4.40 | 5 | 5 | 0.00 |
| Consolidation is needed among smaller Islamic banks | 51.1% | 21.3% | 25.5% | 2.1% | 0.0% | 47 | 4.21 | 5 | 5 | 0.00 |
| The recent crisis would not have happened under a true Islamic banking system | 27.7% | 34.0% | 17.0% | 12.8% | 8.5% | 47 | 3.60 | 4 | 4 | 0.03 |
| Banks in general used to rely heavily on rating agencies | 25.5% | 21.3% | 42.6% | 6.4% | 4.3% | 47 | 3.57 | 3 | 3 | 0.00 |
| Islamic banks will emerge stronger from the current crisis | 10.6% | 59.6% | 10.6% | 10.6% | 8.5% | 47 | 3.53 | 4 | 4 | 0.00 |
| Islamic banks rely less on rating agencies than conventional banks | 6.4% | 27.7% | 53.2% | 12.8% | 0.0% | 47 | 3.28 | 3 | 3 | 0.00 |
| Islamic banks are more resilient to economic shocks than their conventional peers | 17.0% | 23.4% | 36.2% | 14.9% | 8.5% | 47 | 3.26 | 4 | 4 | 0.04 |
| Islamic finance industry should develop its own rating agencies | 8.5% | 25.5% | 31.9% | 21.3% | 12.8% | 47 | 2.96 | 3 | 3 | 0.08 |
| Islamic finance can solve the global crisis | 6.4% | 17.0% | 40.4% | 21.3% | 14.9% | 47 | 2.79 | 3 | 3 | 0.00 |
Notes: n = Number of responses; Scale: 1 = Strongly Disagree (SD), 2 = Disagree (D), 3 = Neutral (N), 4 = Agree (A), 5 = Strongly Agree (SA)
The findings in Figure 7.7 and Table 7.16 can be generalised as follows:
As can be seen from the responses, both groups support the view that IFIs are more resilient to economic shock than their conventional peers. Seventy-two percent of Islamic bankers ranked this statement either ‘SA’ or ‘A’, while 40% of non-Islamic bankers chose either ‘SA’ or ‘A’.
In addition, on aggregate level more than 66% of respondents support the view that the crisis would not have happened under a true Islamic banking system. This was further emphasised by the 34.7% who believe that Islamic finance can solve the global crisis. A breakdown of the two groups shows varying patterns: 76% of Islamic bankers, the total of ‘Strongly Agree’ or ‘Agree’, stated that the crisis would not have happened under a true Islamic banking system, a view shared by circa 61% of non-Islamic bankers. However, while the majority of the former support the view that Islamic finance can solve the global crisis, the majority of non-bankers are not of this view.
Furthermore, most respondents (56.9%) agree that banks in general heavily relied on rating agencies. The same view is shared among the Islamic and non-Islamic bankers. In aggregate, there was no consensus as to whether Islamic banks rely less or more on rating agencies than do conventional banks; however, surprisingly enough, more non-Islamic bankers believe that IFIs rely less on rating agencies than do Islamic bankers, with the majority of these declining such a view.
Moreover, some respondents believe that conventional rating agencies do not fully understand and appreciate certain aspects of IFIs, principally the fiduciary aspect, and that conventional rating methodologies do not recognise the need for a different approach to capital adequacy calculation and accounting standards. However, there is no consensus either on the aggregate level or by non-Islamic bankers as to whether the Islamic finance industry needs to develop its own rating agencies. The majority of Islamic bankers did not support such a view (44%). Although there are some important differences between Islamic and conventional banks that must be properly understood and considered, these can be incorporated within the existing rating frameworks.
The results also demonstrate that more than 69% of respondents support consolidation among smaller Islamic banks; the prevailing opinion is that there are far too many Islamic banks to serve this growing market, but only a handful have the size necessary to compete on a global stage. The same pattern could be traced on breaking down the findings among the two groups.
Lastly, the findings in Table 7.16 and Figure 7.7 show that, on aggregate level, most respondents agreed that Islamic banks will emerge stronger from the crisis as they provide an ethical banking alternative (65.3%). A similar pattern exists between the two groups, as 56% of Islamic bankers and 70.2% of non-Islamic bankers support the view that Islamic banks will emerge stronger from the crisis.
Perceptions of Risk Management and Mitigation
The third part of the questionnaire aims to examine the risk management and hedging techniques used within individual Islamic banks. Risk mitigation has recently come under the spotlight within Islamic banking in particular with the emergence of a number of defaults in the Gulf region. Traditionally, the unique nature of risks faced by Islamic banks, combined with the restrictions added by Shari'ah, makes risk mitigation for Islamic banks a difficult and complex process. There are risks that Islamic banks, similar to their conventional counterparts, can manage and control through appropriate risk policies, controls and traditional risk management tools. However, there are other risks that banks cannot eliminate and that can only be reduced or moderated by transferring or selling those risks in well-defined markets. The challenge is, however, that most of the conventional hedging tools do not so far comply with the Shari'ah requirements, which limits the available tools of risk management for Islamic banks.
Risk management and reporting The first part of this section aims to depict the findings related to risk management reporting used by the institutions of the participants. Table 7.17 shows the different risk management reports that participating banks produce and the frequency of publishing those reports, while Table 7.18 shows the frequency distribution of the findings among Islamic and conventional banks (including Islamic subsidiaries).
TABLE 7.17 Risk management reports – market practice
| Report | Daily | Weekly | Monthly | Yearly | Never | Don't Know | Total Responses |
| Capital requirement report | 44% | 24% | 31% | — | — | 2% | 100% |
| Operational risk report | 37% | 17% | 37% | 2% | — | 3% | 97% |
| Profit rate risk report | 56% | 10% | 29% | — | — | 3% | 98% |
| Foreign exchange risk report | 42% | 20% | 29% | — | — | 3% | 95% |
| Liquidity risk report | 61% | 25% | 14% | — | — | — | 100% |
| Commodity risk report | 39% | 5% | 24% | 0% | 29% | 3% | 100% |
| Country risk report | 54% | 17% | 29% | — | — | — | 100% |
| Equity mark-to-market report | 51% | 12% | 22% | 5% | 5% | 5% | 100% |
| Classified accounts report | 27% | 3% | 47% | 17% | — | 2% | 97% |
| Industry concentration risk report | 42% | — | 53% | 2% | — | 2% | 98% |
| Credit exposure report | 68% | 3% | 29% | — | — | — | 100% |
| Large exposure report | 58% | — | 34% | — | 3% | 3% | 98% |
| Other risk reports | |||||||
| Market risk | 5% | — | 5% | — | — | — | 10% |
| Stress testing | 0% | — | 5% | — | — | — | 5% |
| Counterparty concentration | 3% | — | 3% | — | — | — | 7% |
| Collateral management | 3% | — | — | — | — | — | 3% |
TABLE 7.18 Risk management reports – Islamic versus conventional banks
| Fully Fledged Islamic Banks | |||||||
| Report | Daily | Weekly | Monthly | Yearly | Never | Don't Know | Total Responses |
| Capital requirement report | 36% | 24% | 36% | — | — | 4% | 100% |
| Operational risk report | 32% | 8% | 44% | 4% | — | 4% | 92% |
| Profit rate risk report | 48% | 8% | 36% | — | — | 4% | 96% |
| Foreign exchange risk report | 28% | 24% | 32% | — | — | 8% | 92% |
| Liquidity risk report | 52% | 36% | 12% | — | — | — | 100% |
| Commodity risk report | 8% | — | 20% | — | 68% | 4% | 100% |
| Country risk report | 28% | 32% | 40% | — | — | — | 100% |
| Equity mark-to-market report | 16% | 12% | 36% | 12% | 12% | 12% | 100% |
| Classified accounts report | — | 4% | 48% | 40% | — | — | 96% |
| Industry concentration risk report | 16% | — | 76% | 4% | — | — | 96% |
| Credit exposure report | 48% | 8% | 44% | — | — | — | 100% |
| Large exposure report | 28% | — | 56% | — | 8% | 8% | 100% |
| Other risk reports | 0% | ||||||
| Market risk | 4% | — | 4% | — | — | — | 8% |
| Stress testing | — | — | 8% | — | — | — | 8% |
| Counterparty concentration | 4% | — | 4% | — | — | — | 8% |
| Collateral management | 4% | — | — | — | — | — | 4% |
| Conventional Banks (including Islamic subsidiaries) | |||||||
| Report | Daily | Weekly | Monthly | Yearly | Never | Don't Know | Total Responses |
| Capital requirement report | 50% | 24% | 26% | — | — | — | 100% |
| Operational risk report | 41% | 24% | 32% | — | — | 3% | 100% |
| Profit rate risk report | 62% | 12% | 24% | — | — | 3% | 100% |
| Foreign exchange risk report | 53% | 18% | 26% | — | — | — | 97% |
| Liquidity risk report | 68% | 18% | 15% | — | — | — | 100% |
| Commodity risk report | 62% | 9% | 26% | — | — | 3% | 100% |
| Country risk report | 74% | 6% | 21% | — | — | — | 100% |
| Equity mark-to-market report | 76% | 12% | 12% | — | — | — | 100% |
| Classified accounts report | 47% | 3% | 47% | — | — | — | 97% |
| Industry concentration risk report | 62% | 0% | 35% | — | — | 3% | 100% |
| Credit exposure report | 82% | 0% | 18% | — | — | — | 100% |
| Large exposure report | 79% | 0% | 18% | — | — | — | 97% |
| Other risk reports | |||||||
| Market risk | 6% | — | 6% | — | — | — | 12% |
| Stress testing | — | 3% | — | — | — | 3% | |
| Counterparty concentration | 3% | — | 3% | — | — | — | 6% |
| Collateral management | 3% | — | — | — | — | — | 3% |
As depicted by Table 7.17, the most widely used reports in general are capital requirement, liquidity risk and credit exposure reports, followed by industry concentration risk and profit rate risk reports. The commodity risk report is the least used with 29% of respondents indicating it is not used. Some institutions produce other specific reports not listed in the questionnaire like market risk reports (10%), stress-testing reports (5%), counterparty concentration reports (7%) and collateral management reports (3%).
In terms of frequency of producing these reports, the credit exposure report is the most produced daily report, followed by the liquidity risk report and profit rate risk report. The classified accounts report is the least produced daily report (27%) as banks tend to produce it on a monthly basis. As the findings show, 31 institutions indicate that they produce industry concentration risk report on a monthly basis, followed by classified accounts report (47%) and operational risk report (37% respondents). A small number of respondents indicated that they produce some reports annually. Finally, few respondents indicated that they do not know the frequency of reports' production; this is because these respondents work in non-risk management rules like traders and financial officers.
The analysis in Table 7.18 in a comparative manner shows that IFIs use the same risk management techniques as conventional banks for managing the risks, in particular liquidity, credit and market risks. Nevertheless, the spread and frequency of utilising these techniques is lower among Islamic banks compared to their conventional peers. Generally, IFIs still use less technically advanced risk measurement approaches as they are still in the emerging phase and do not have sufficient resources and systems to use more technically advanced techniques. The most widely used report among IFIs on a daily basis is liquidity risk report, followed by credit exposure report and profit rate risk report. Commodity risk and equity mark-to-market reports are the least used by IFIs in this survey.
Risk measurement In addition to risk management reports, financial institutions use various techniques to measure and analyse risks. Table 7.19 exhibits different techniques used to measure and assess risks. There may be a variety of formats in which these techniques can be used, ranging from simple analysis to sophisticated models. The most common technique used by IFIs as indicated by respondents is maturity matching analysis (88%), followed by reliance on external ratings provided by rating agencies (84%), internal based rating and gap analysis (76% each). Only 56% indicated they use Value at Risk (VaR) models, while simulation techniques are used by just six IFIs in the sample to assess different risks.
TABLE 7.19 Risk measurement techniques
(a) | ||||
| Fully Fledged Islamic Banks | Conventional Banks | |||
| Risk Management Technique | Total Responses | Percentage | Total Responses | Percentage |
| Internal based ratings | 19 | 76.0% | 30 | 88.2% |
| Credit ratings by rating agencies | 21 | 84.0% | 32 | 94.1% |
| Gap analysis | 19 | 76.0% | 28 | 82.4% |
| Duration analysis | 17 | 68.0% | 29 | 85.3% |
| Maturity matching analysis | 22 | 88.0% | 31 | 91.2% |
| Earnings at risk | 11 | 44.0% | 27 | 79.4% |
| Value at risk | 14 | 56.0% | 23 | 67.6% |
| Stress testing | 15 | 60.0% | 22 | 64.7% |
| Simulation techniques | 6 | 24.0% | 16 | 47.1% |
| Risk Adjusted Rate of Return on Capital (RAROC) | 8 | 32.0% | 26 | 76.5% |
| Others | ||||
| (b) | ||
| Ranking | Fully Fledged Islamic Banks | Conventional Banks |
| 1 | Maturity matching analysis | Credit ratings by rating agencies |
| 2 | Credit ratings by rating agencies | Maturity matching analysis |
| 3 | Internal based ratings | Internal based ratings |
| 4 | Gap analysis | Duration analysis |
| 5 | Duration analysis | Gap analysis |
| 6 | Stress testing | Earnings at risk |
| 7 | Value at risk | RAROC |
| 8 | Earnings at risk | Value at risk |
| 9 | RAROC | Stress testing |
| 10 | Simulation techniques | Simulation techniques |
Notes: a) Question 18 is applicable only to respondents in the banking field, whether Islamic or conventional; b) Conventional banks include Islamic subsidiaries
Comparing these figures to the responses by conventional bankers emphasises the fact that risk management techniques in Islamic banking are not as sophisticated as in the conventional banking world. The most common technique used by conventional banks is external ratings provided by rating agencies (94.1%), followed by maturity matching analysis (91.2%), internal based rating (88.2%) and duration analysis (85.3%).
Moreover, the results for this question confirm those obtained by Question 11 as reported in the preceding section. As discussed in the section ‘Additional risk issues facing IFIs’ in Chapter 8, more than 65% of respondents either ‘Agree’ or ‘Strongly Agree’ that risk management for IFIs is more challenging as compared to the conventional banks. In addition, around 57% of respondents believe that risk management for IFIs should not use the same tools as conventional banks.
Risk mitigation A comparative analysis was conducted on risk mitigation between Islamic and conventional banks. As can be seen in Figure 7.8, 72.2% of respondents believe that risk mitigation techniques in Islamic banking are less advanced than conventional banking. Table 7.20 provides detailed analysis of the findings.

FIGURE 7.8 Risk mitigation in Islamic banking versus conventional banking
TABLE 7.20 Risk mitigation in Islamic banking
| Region | Fully Fledged Islamic Bank | Conventional Bank | Conventional Bank with Islamic Activities | Others | Total | |
| Don't know | Europe | 0.0% | 2.8% | 2.8% | 1.4% | 6.9% |
| GCC | 0.0% | 2.8% | 1.4% | 1.4% | 5.6% | |
| Other Middle East | 1.4% | 0.0% | 0.0% | 1.4% | 2.8% | |
| Less advanced | Americas | 0.0% | 1.4% | 0.0% | 1.4% | 2.8% |
| Europe | 6.9% | 6.9% | 5.6% | 1.4% | 20.8% | |
| GCC | 12.5% | 1.4% | 6.9% | 1.4% | 22.2% | |
| Other | 2.8% | 0.0% | 0.0% | 1.4% | 4.2% | |
| Other Middle East | 5.6% | 9.7% | 0.0% | 1.4% | 16.7% | |
| Southeast Asia | 4.2% | 0.0% | 0.0% | 1.4% | 5.6% | |
| Similar | Americas | 0.0% | 1.4% | 0.0% | 1.4% | 2.8% |
| Europe | 0.0% | 1.4% | 1.4% | 1.4% | 4.2% | |
| GCC | 0.0% | 0.0% | 1.4% | 1.4% | 2.8% | |
| Southeast Asia | 1.4% | 0.0% | 0.0% | 1.4% | 2.8% | |
| Total | 34.7% | 27.8% | 19.4% | 18.1% | 100% |
The results depicted in Table 7.20 can be summarised as follows:
- The majority of respondents (72.2%) believe that risk mitigation in Islamic banking is less advanced than conventional banking. The main responses came from fully fledged Islamic banks in the GCC (12.5%), followed by conventional banks in Other Middle East (9.7%) and Islamic subsidiaries in the GCC (6.9%).
- 15.3% of the respondents indicated that they ‘Don't know’ whether risk mitigation techniques in Islamic banking are more or less advanced than those used is conventional banking. Within this category, conventional banks in Europe, conventional banks in the GCC, and Islamic subsidiaries in Europe had the main responses with 2.8% of total responses each.
- 12.5% of respondents believe that risk mitigation techniques are similar in Islamic and conventional banking. The main responses in this category came from Europe (4.2%), followed by Americas, GCC and Southeast Asia with 1.4% each;
- No respondents believe that risk mitigation techniques are more advanced in Islamic banking than in conventional banking.
In searching for risk and risk management attitudes in Islamic banks, the participants were also asked to express their opinions on risk mitigation techniques. These results obtained from Question 19 were confirmed by the poor responses for Question 20 about the techniques IFIs use to mitigate their risks as summarised in Table 7.21.
TABLE 7.21 Risk mitigation techniques
| Risk Mitigation Technique | Total Responses | Percentage of Total Sample |
| On-balance sheet netting | 25 | 64.1% |
| Collateral arrangements | 36 | 92.3% |
| Islamic options | 10 | 25.6% |
| Islamic swaps | 14 | 35.9% |
| Guarantees | 30 | 76.9% |
| Islamic currency forwards | 32 | 82.1% |
| Parallel contracts | 12 | 30.8% |
| Other (please specify) | 1 | 2.6% |
Notes: Question 20 is applicable only to Islamic banks and conventional banks with Islamic activities. Total sample for this question = 39 respondents
This question is only applicable to fully fledged Islamic banks and Islamic subsidiaries of conventional banks as the listed risk mitigation techniques are all Shari'ah-compliant. As summarised in Table 7.21, collateral arrangements is the most commonly used technique (92.3%), followed by Islamic currency forwards (82.1%) and guarantees (76.9%). Dual currency murabahah represented under ‘Others’ is the least used risk mitigation techniques at 2.6% of responses.
The reasons for the lack of usage of Shari'ah-compliant risk mitigation techniques may be because those techniques are subject to different interpretation by Shari'ah scholars. Other reasons may include that, as previously indicated in Table 7.8, salam and istisna'a contracts are not widely used in IFIs. As explained in Chapter 3, there have been substantial efforts in developing Shari'ah-compliant hedging instruments; however, much of this progress remains localised with limited scope for cross-border application and further work is still needed.
Evaluating the Practice of Islamic Banking
This last section aims to analyse the opinions and the evaluation of the participants on the practice of Islamic banking. One of the main statements considered in this section is the proposition that Islamic banking has been diverting from its roots by mimicking conventional banks. In doing so, Question 21, a closed question, provided four statements, and respondents were requested to express their preference in terms of how strongly they agree or disagree with each statement. The frequency results for the entire sample are summarised by Figure 7.9, while Table 7.22 breaks down the findings between Islamic bankers and non-Islamic bankers (including Islamic subsidiaries, conventional banks and others) and ranks the importance of statements according to their mean values.
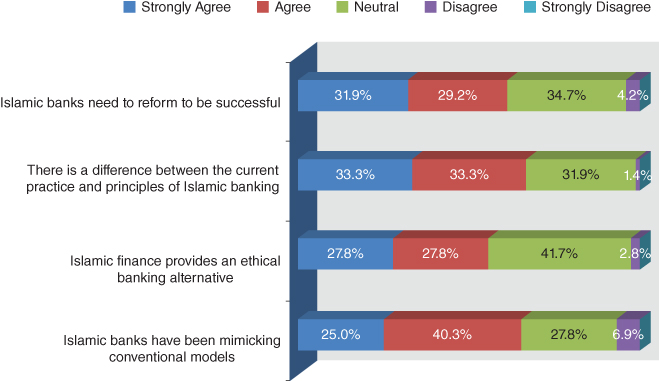
FIGURE 7.9 Frequency distribution for Question 21: current practices in Islamic banking
TABLE 7.22 Breakdown of perceptions about current practices in Islamic banking
| Total Sample | ||||||||||
| Statement | SA | A | N | D | SD | n | Mean | Median | Mode | Chi-Square |
| There is difference between the current practice and principles of Islamic banking | 33.3% | 33.3% | 31.9% | 1.4% | 0.0% | 72 | 3.99 | 4 | 4 | 0.00 |
| Islamic banks need to reform to be successful | 31.9% | 29.2% | 34.7% | 4.2% | 0.0% | 72 | 3.89 | 4 | 3 | 0.00 |
| Islamic banks have been mimicking conventional models | 25.0% | 40.3% | 27.8% | 6.9% | 0.0% | 72 | 3.83 | 4 | 5 | 0.00 |
| Islamic finance provides an ethical banking alternative | 27.8% | 27.8% | 41.7% | 2.8% | 0.0% | 72 | 3.81 | 4 | 3 | 0.00 |
| Fully Fledged Islamic Banks | ||||||||||
| Statement | SA | A | N | D | SD | n | Mean | Median | Mode | Chi-Square |
| There is difference between the current practice and principles of Islamic banking | 44.0% | 32.0% | 20.0% | 4.0% | 0.0% | 25 | 4.16 | 4 | 4 | 0.01 |
| Islamic finance provides an ethical banking alternative | 44.0% | 20.0% | 36.0% | 0.0% | 0.0% | 25 | 4.08 | 4 | 5 | 0.00 |
| Islamic banks need to reform to be successful | 28.0% | 40.0% | 28.0% | 4.0% | 0.0% | 25 | 3.92 | 4 | 4 | 0.01 |
| Islamic banks have been mimicking conventional models | 28.0% | 44.0% | 16.0% | 12.0% | 0.0% | 25 | 3.88 | 4 | 5 | 0.00 |
| Non-Islamic Bankers (including Islamic subsidiaries, conventional banks and others) | ||||||||||
| Statement | SA | A | N | D | SD | n | Mean | Median | Mode | Chi-Square |
| There is difference between the current practice and principles of Islamic banking | 27.7% | 34.0% | 38.3% | 0.0% | 0.0% | 47 | 3.89 | 4 | 4 | 0.00 |
| Islamic banks need to reform to be successful | 34.0% | 23.4% | 38.3% | 4.3% | 0.0% | 47 | 3.87 | 4 | 3 | 0.00 |
| Islamic banks have been mimicking conventional models | 23.4% | 38.3% | 34.0% | 4.3% | 0.0% | 47 | 3.81 | 4 | 3 | 0.00 |
| Islamic finance provides an ethical banking alternative | 19.1% | 31.9% | 44.7% | 4.3% | 0.0% | 47 | 3.66 | 4 | 3 | 0.00 |
Notes: n = Number of responses; Scale: 1 = Strongly Disagree (SD), 2 = Disagree (D), 3 = Neutral (N), 4 = Agree (A), 5 = Strongly Agree (SA)
As can be seen from the findings depicted in Table 7.22 and Figure 7.9, on both aggregate and individual levels, the majority of respondents either ‘Strongly Agree’ or ‘Agree’ with the four statements. Although Islamic finance provides an ethical banking alternative, IFIs need to reform before they can exploit the ethical foundation in the Islamic banking model. The responses of Islamic bankers and non-Islamic bankers were close, with the former's responses being closer to ‘SA’ than the latter. These findings are supported by the significant results of the Chi-Square test (p <1%). However, the mean rankings for the responses of Islamic bankers are higher than those of non-Islamic bankers across all statements, reflecting higher risk perceptions.
The Future of Islamic Banking
The last section of the questionnaire includes a forward-looking question that explores different strategies IFIs should follow in order to prepare for the future. The participants were provided a number of statements and asked to express their opinions. The results related to the growth strategies for IFIs are presented in Table 7.23.
TABLE 7.23 Growth strategies for IFIs
| Total Sample | |||||
| Strategy | n | Mean | Median | Mode | Chi-Square |
| Improved risk management | 72 | 6.75 | 2 | 1 | 0.0 |
| Better risk mitigation | 72 | 6.33 | 2 | 2 | 0.0 |
| Enhanced morality – back to roots | 72 | 5.72 | 3 | 5 | 0.0 |
| Diversification – reduce concentration | 72 | 5.24 | 3 | 3 | 0.0 |
| Innovation | 72 | 3.26 | 6 | 8 | 0.0 |
| Standardisation | 72 | 3.14 | 7 | 7 | 0.0 |
| Mergers and acquisitions | 72 | 3.08 | 6 | 6 | 0.0 |
| Organic growth in home market | 72 | 2.49 | 7 | 8 | 0.0 |
| Fully Fledged Islamic Banks | |||||
| Strategy | n | Mean | Median | Mode | Chi-Square |
| Improved risk management | 25 | 6.64 | 2 | 1 | 0.0 |
| Enhanced morality – back to roots | 25 | 5.96 | 3 | 1 | 0.1 |
| Better risk mitigation | 25 | 5.88 | 3 | 4 | 0.0 |
| Diversification – reduce concentration | 25 | 4.44 | 4 | 8 | 1.0 |
| Innovation | 25 | 3.72 | 5 | 6 | 0.3 |
| Mergers and acquisitions | 25 | 3.32 | 6 | 6 | 0.1 |
| Organic growth in home market | 25 | 3.16 | 7 | 8 | 0.1 |
| Standardisation | 25 | 2.88 | 7 | 7 | 0.0 |
| Non-Islamic Bankers (including Islamic subsidiaries, conventional banks and others) | |||||
| Strategy | n | Mean | Median | Mode | Chi-Square |
| Improved risk management | 47 | 6.81 | 2 | 1 | 0.0 |
| Better risk mitigation | 47 | 6.57 | 2 | 2 | 0.0 |
| Diversification – reduce concentration | 47 | 5.66 | 3 | 3 | 0.0 |
| Enhanced morality – Back to roots | 47 | 5.60 | 4 | 5 | 0.0 |
| Standardisation | 47 | 3.28 | 6 | 8 | 0.0 |
| Innovation | 47 | 3.02 | 6 | 8 | 0.0 |
| Mergers and acquisitions | 47 | 2.96 | 6 | 6 | 0.0 |
| Organic growth in home market | 47 | 2.13 | 7 | 8 | 0.0 |
Table 7.23 reveals that both Islamic and non-Islamic bankers (including Islamic subsidiaries, conventional banks and others) consider improved risk management and mitigation practices among the top priorities IFIs should focus on in their development plans. While Islamic bankers ranked ‘Enhanced morality – back to roots’ second (mean = 5.96), non-Islamic bankers ranked it in fourth place (mean = 5.60). ‘Diversification’ was highly ranked by both groups, while mergers and acquisitions, and organic growth in home market received lower ranking. Non-Islamic bankers ranked ‘Standardisation’ higher than Islamic bankers.
These findings are supported by the significant results of the Chi-Square test for most strategies. In addition, Spearman's Rank Correlation Coefficient shows that at the 5% significance level the rankings of the two groups are correlated (ρ= 0.9405>0.643) as depicted in Table 7.24.
TABLE 7.24 Correlation between perceptions of Islamic and conventional banks about growth strategies for IFIs
| Islamic Banks Median | Conventional Banks Median | Difference | (Difference)2 | |
| Improved risk management | 2 | 2 | 0 | 0 |
| Enhanced morality – back to roots | 3 | 4 | 1 | 1 |
| Mergers and acquisitions | 6 | 6 | 0 | 0 |
| Organic growth in home market | 7 | 7 | 0 | 0 |
| Better risk mitigation | 3 | 2 | −1 | 1 |
| Innovation | 5 | 6 | 1 | 1 |
| Diversification – reduce concentration | 4 | 3 | −1 | 1 |
| Standardisation | 7 | 6 | −1 | 1 |
| Spearman's Rank Correlation Coefficient | 0.94048 |
CONCLUSION
This chapter is the first empirical analysis chapter of the quantitative data assembled through survey questionnaire where mainly descriptive statistics were applied to the primary data. Frequency distribution is among the descriptive statistics used, in addition to Spearman's Rank Correlation Coefficient test and Chi-Square test. The analyses produced results on different aspects of risk management in Islamic banking, which are summarised and explained in the context of the research objectives.
The findings in this chapter show that, although IFIs face additional risks to those faced by conventional financial institutions, both Islamic and conventional bankers have similar perceptions about risk management in Islamic banking. Liquidity, ALM and concentration risk were among the top risks identified by both groups. Moreover, profit-sharing modes of financing and product-deferred sales are perceived to be more risky than murabahah, wakalah and ijarah. This explains why IFIs shy away from such instruments due to their lack of appetite for risky assets, which in turn is due to IFIs trying to emulate the conventional model. The manipulation of the contracts by Islamic finance practitioners, in order to mimic conventional products, made the risk perception of equity and risk-sharing contracts, for instance wakalah, similar to risk perception of fixed-income contracts like murabahah. This manipulation caused the contracts to behave differently and created a gap in risk perceptions.
The findings also indicate that, although IFIs are doing comparatively well in terms of their general risk management and reporting, they are still perceived as using less advanced risk management approaches. Shari'ah-compatible risk mitigation techniques are also not widely used by IFIs. Developing Shari'ah-compliant risk mitigation and hedging tools, in addition to improving risk management and reporting practices, represents a serious challenge to Islamic banking in order to lift itself to the next level. Most IFIs use Basel II capital adequacy standards, with greater use of basic and standardised approaches rather than advanced models. This is due to the relative simplicity of their capital requirements. The majority of respondents perceived that Basel II could be applied to IFIs, but with a few amendments.
It is interesting to note that both Islamic and non-Islamic bankers share the view that, although IFIs have shown resilience, they are not immune from economic shocks. Broadly speaking, Islamic banking had a relatively ‘mild crisis’ in that it suffered less damage as a result of the global economic and financial turmoil of the past few years than conventional banking.
Empirical evidence shows that Islamic banking is expected to emerge stronger from the crisis, provided some conditions are met, such as: ‘further innovation’, ‘enhanced transparency’, ‘more robust risk management architecture and culture’ and above all ‘enhanced Shari'ah-compliance’.
After providing some descriptive analysis of the general characteristics of the sample, and examining the research questions and hypotheses, the findings of this chapter will be further analysed by the inferential statistical analysis in Chapter 8, which studies the attitudes of the respondents by providing a comparative analysis between several identified groups or respondents' categories.