Chapter 9
Supply
Uncertainty
9.1 Introduction to Supply Uncertainty
Supply chains are subject to many types of uncertainty, and many approaches have been proposed for modeling uncertainty in the supply chain. So far in this book, we have primarily considered uncertainty in demand. In this chapter, we study models that consider uncertainty in supply; in other words, what happens when a firm's suppliers, or the firm's own facilities, are unreliable.
Supply uncertainty may take a number of forms. These include:
- Disruptions. A disruption interrupts the supply of goods at some stage in the supply chain. Disruptions tend to be binary events—either there's a disruption or there isn't. During a disruption, there's generally no supply available. Disruptions may be due to bad weather, natural disasters, strikes, suppliers going out of business, etc.
- Yield Uncertainty. Sometimes the quantity that a supplier can provide falls short of the amount ordered; the amount actually supplied is random. This is called yield uncertainty. It can be the result of product defects, or of batch processes in which only a certain percentage of a given batch (the yield) is usable.
- Capacity Uncertainty. Uncertainty in the quantity that a supplier can provide. Whereas yield uncertainty is typically dependent on the order quantity (e.g., we order S units, but only a portion of them are usable), capacity uncertainty usually assumes the capacity is independent of the order quantity, and the supplier will deliver the minimum of the two.
- Lead Time Uncertainty. Uncertainty in the supply lead time can result from stockouts at the supplier, manufacturing or transit delays, and so on. In this case, the lead time L that figures into many of the models in this book must be treated as a random variable rather than a constant. See, for example, Section 5.3.3.
In this chapter, we will discuss the first two types of supply uncertainty. We will discuss models for setting inventory levels in the presence of disruptions in Section 9.2 and in the presence of yield uncertainty in Section 9.3. In both sections, we will cover models that are analogous to the classical economic order quantity (EOQ) and infinite‐horizon newsvendor models (the models from Sections 3.2 and 4.3.4). We discuss a newsvendor‐type model with a more general supply process in Section 9.4. Next, we discuss the risk‐diversification effect, a supply‐uncertainty version of the risk‐pooling effect , in Section 9.5. Finally, in Section 9.6, we discuss a facility location model with supply uncertainty in the form of disruptions.
In most of the models in this chapter, we will assume that demand is deterministic. We do this for tractability, but also, more importantly, to highlight the effect of supply uncertainty, in the absence of demand uncertainty.
In some ways, there is no conceptual difference between supply uncertainty and demand uncertainty. After all, having too little supply is the same as having too much demand. A firm might use similar strategies for dealing with the two types of uncertainty, as well—for example, holding safety stock, utilizing multiple suppliers, or improving its forecasts of the uncertain events. But, as we will see, the ways in which we model these two types of uncertainty, and the insights we get from these models, can be quite different. (For more on this issue, see Snyder and Shen (2006).)
For reviews of the literature on disruptions, see Snyder et al. (2016) and Vakharia and Yenipazarli (2008), and for yield uncertainty, see Yano and Lee (1995) and Grosfeld Nir and Gerchak (2004). Ciarallo et al. (1994) discuss capacity uncertainty. For an overview of models with lead‐time uncertainty, see Zipkin (2000).
9.2 Inventory Models with Disruptions
Disruptions are usually modeled using a two‐state Markov process in which one state represents the supplier operating normally and the other represents a disruption. These states may be known as up/down, wet/dry, on/off, normal/disrupted, and so on. (We'll use the terms up/down.) Not surprisingly, continuous‐review models (such as the one in Section 9.2.1) use continuous‐time Markov chains (CTMCs) , while periodic‐review models (Section 9.2.2) use discrete‐time Markov chains (DTMCs) . The time between disruptions and the length of disruptions are therefore exponentially or geometrically distributed (in the case of CTMCs and DTMCs, respectively). The models presented here assume the inventory manager knows the state of the supplier at all times.
Some papers also consider more general disruption processes than the ones we consider here—for example, nonstationary disruption probabilities (Snyder and Tomlin, 2007) or partial disruptions (Güllü et al., 1999). These disruption processes can also usually be modeled using Markov processes.
9.2.1 The EOQ Model with Disruptions
9.2.1.1 Problem Statement
Consider the classical EOQ model with fixed order cost K and holding cost h per unit per year. The demand rate is d units per year (a change from our notation in Section 3.2). Suppose that the supplier is not perfectly reliable—that it functions normally for a certain amount of time (an up interval) and then shuts down for a certain amount of time (a down interval). The transitions between these intervals are governed by a CTMC. During down intervals, no orders can be placed, and if the retailer runs out of inventory during a down interval, all demands observed until the beginning of the next up interval are lost, with a stockout cost of p per lost sale. During up intervals, the lead time is 0. Both types of intervals last for a random amount of time. Every order placed by the retailer is for the same fixed quantity Q. Our goal is to choose Q to minimize the expected annual cost.
This problem, which is known as the EOQ with disruptions (EOQD), was first introduced by Parlar and Berkin (1991), but their analysis contained two errors that rendered their model incorrect. A correct model was presented by Berk and Arreola‐Risa (1994), whose treatment we follow here.
Let X and Y be the duration of a given up and down interval, respectively. X and Y are exponentially
distributed random variables, X with rate ![]() and Y with rate
and Y with rate ![]() . (Recall that if
. (Recall that if ![]() , then
, then ![]() ,
, ![]() , and
, and ![]() .) The parameters
.) The parameters ![]() and
and ![]() are called the disruption rate
and recovery rate,
respectively. These are the transition rates for the CTMC.
are called the disruption rate
and recovery rate,
respectively. These are the transition rates for the CTMC.
The EOQ inventory curve now looks something like Figure 9.1. Note that the inventory position never becomes negative because excess demands are lost, not backordered. The time between successful orders is called a cycle.
The length of a cycle,
T, is a random variable. If the supplier is in an up interval when the inventory level reaches 0, then ![]() , otherwise,
, otherwise, ![]() .
.

Figure 9.1 EOQ inventory curve with disruptions.
Note: In the EOQ, we ignored the per‐unit purchase cost c because the annual per‐unit cost is independent of Q (since d units are ordered every year, regardless of Q). It is not strictly correct to ignore c in the EOQD because, in the face of lost sales, the number of units ordered each year may not equal d, and in fact it depends on Q. Nevertheless, we will ignore c for tractability reasons.
9.2.1.2 Expected Cost
Let ![]() be the probability that the supplier is in a down interval when the inventory level hits 0. One can show that
be the probability that the supplier is in a down interval when the inventory level hits 0. One can show that
Let ![]() be the pdf of T, the time between successful orders. Then
be the pdf of T, the time between successful orders. Then

Note that ![]() has a point mass at
has a point mass at ![]() and is continuous afterwards.
and is continuous afterwards.
Each cycle lasts at least ![]() years. After that, with probability
years. After that, with probability ![]() , it lasts an additional 0 years, and with probability
, it lasts an additional 0 years, and with probability ![]() , it lasts, on average, an additional
, it lasts, on average, an additional ![]() years (because of the memoryless property
of the exponential distribution).
Therefore, the expected length of a cycle
is given by
years (because of the memoryless property
of the exponential distribution).
Therefore, the expected length of a cycle
is given by
We're interested in finding an expression for the expected cost per year. It's difficult to write an expression for this cost directly. On the other hand, we can calculate the expected cost of one cycle, as well as the expected length of a cycle, and the time between orders is iid. This implies that we can use the renewal‐reward theorem
(Theorem 4.7), treating each successful order as a renewal point. In particular, the renewal‐reward theorem tells us that the expected cost per year, ![]() , is given by
, is given by
The denominator is given by 9.2; it remains to find an expression for the numerator.
In each cycle, we place exactly one order, incurring a fixed cost of K.
The inventory in a given cycle is positive for exactly ![]() years (regardless of whether there's a disruption), so the holding cost
is based on the area of one triangle in Figure 9.1, namely
years (regardless of whether there's a disruption), so the holding cost
is based on the area of one triangle in Figure 9.1, namely ![]() . Finally, we incur a penalty cost if the supplier is in a down interval when the inventory level hits 0. This happens with probability
. Finally, we incur a penalty cost if the supplier is in a down interval when the inventory level hits 0. This happens with probability ![]() , and if it does happen, the expected remaining duration of the down interval is
, and if it does happen, the expected remaining duration of the down interval is ![]() . Therefore, the expected stockout cost per cycle is
. Therefore, the expected stockout cost per cycle is ![]() . Then the total expected cost per cycle is
. Then the total expected cost per cycle is
We can use 9.2–9.4 to derive the expected cost per year; the result is stated in the next proposition.
9.2.1.3 Solution Method
Remember that ![]() is a function of Q, and in fact it's a pretty messy function of Q. Therefore, 9.5 can't be solved in closed form—that is, we can't take a derivative, set it equal to 0, and solve for Q. Instead, it must be solved numerically using line search techniques such as bisection search.
These techniques typically assume that
is a function of Q, and in fact it's a pretty messy function of Q. Therefore, 9.5 can't be solved in closed form—that is, we can't take a derivative, set it equal to 0, and solve for Q. Instead, it must be solved numerically using line search techniques such as bisection search.
These techniques typically assume that ![]() is convex.
Unfortunately, it is not known whether
is convex.
Unfortunately, it is not known whether ![]() is convex with respect to Q, but it is known that
is convex with respect to Q, but it is known that ![]() is quasiconvex
in Q. A quasiconvex function has only one local minimum, which is a sufficient condition for most line search techniques to work.
is quasiconvex
in Q. A quasiconvex function has only one local minimum, which is a sufficient condition for most line search techniques to work.
There's nothing wrong with solving the EOQD numerically, insofar as the algorithm for doing so is quite efficient. On the other hand, it's desirable to have a closed‐form solution for it for two main reasons. One is that we may want to embed the EOQD into some larger model rather than implementing it as‐is. (See, e.g., Qi et al. (2010).) Doing so may require a closed‐form expression for the optimal solution or the optimal cost. The other reason is that we can often get insights from closed‐form solutions that we can't get from solutions we have to obtain numerically.
Although we can't get an exact solution for the EOQD in closed form, we can get an approximate one. In particular, Snyder (2014) approximates ![]() by ignoring the exponential term:
by ignoring the exponential term:
![]() is the probability that the supplier is in a down interval at an arbitrary point in time. But
is the probability that the supplier is in a down interval at an arbitrary point in time. But ![]() refers to a specific point in time, i.e., the point when the inventory level hits 0, and the term
refers to a specific point in time, i.e., the point when the inventory level hits 0, and the term ![]() in the definition of
in the definition of ![]() accounts for the knowledge that, when this happens, we were in an up interval
accounts for the knowledge that, when this happens, we were in an up interval ![]() years ago.
years ago.
By replacing ![]() with
with ![]() , then, we are essentially assuming that the system approaches steady state quickly enough that when the inventory level hits 0, we can ignore this bit of knowledge, i.e., ignore the transient nature of the system at this moment. The approximation is most effective, then, when cycles
tend to be long; e.g., when
, then, we are essentially assuming that the system approaches steady state quickly enough that when the inventory level hits 0, we can ignore this bit of knowledge, i.e., ignore the transient nature of the system at this moment. The approximation is most effective, then, when cycles
tend to be long; e.g., when ![]() is large. If
is large. If ![]() is large, then
is large, then ![]() is large,
is large, ![]() is small, and
is small, and ![]() . The approximation tends to be quite tight for reasonable values of the parameters.
. The approximation tends to be quite tight for reasonable values of the parameters.
The advantage of using ![]() in place of
in place of ![]() is that the resulting expected cost function no longer has any exponential terms, and we can set its derivative to 0 and solve for Q in closed form. (See Problem 9.7(b).) This also allows us to perform some of the same analysis on the EOQD that we do on the EOQ—for example, we can perform sensitivity analysis, develop worst‐case bounds for power‐of‐two policies, and so on. It also allows an examination of the cost of using the classical EOQ solution when disruptions are possible; as it happens, the cost of this error can be quite
large.
is that the resulting expected cost function no longer has any exponential terms, and we can set its derivative to 0 and solve for Q in closed form. (See Problem 9.7(b).) This also allows us to perform some of the same analysis on the EOQD that we do on the EOQ—for example, we can perform sensitivity analysis, develop worst‐case bounds for power‐of‐two policies, and so on. It also allows an examination of the cost of using the classical EOQ solution when disruptions are possible; as it happens, the cost of this error can be quite
large.
9.2.2 The Newsvendor Problem with Disruptions
In this section, we consider the infinite‐horizon newsvendor problem of Section 4.3.4, except that in place of demand uncertainty, we have supply uncertainty, in the form of disruptions. We know from Section 4.3.4 that in the case of demand uncertainty, a base‐stock policy is optimal, with the optimal base‐stock level given by
(if demand is normally distributed and ![]() ). We will see that the optimal solution for the problem with supply uncertainty has a remarkably similar form.
). We will see that the optimal solution for the problem with supply uncertainty has a remarkably similar form.
The model we discuss below can be viewed as a special case of models introduced by Güllü et al. (1997) and by Tomlin (2006). Elements of our analysis are adapted from Tomlin (2006) and from the unabridged version of that paper (Tomlin, 2005). Some of the analysis can also be found in Schmitt et al. (2010).
9.2.2.1 Problem Statement
As in Section 9.2.1 on the EOQD, we assume that demand is deterministic; it's equal to d units per period. (d need not be an integer.) On‐hand inventory and backorders incur costs of h and p per unit per period, respectively. There is no lead time. The sequence of events is identical to that described in Section 4.3, except that in step 2, no order is placed if the supplier is disrupted.
The probability that the supplier is disrupted in the next period depends on its state in the current period. In other words, the disruption process follows a two‐state DTMC. Let
We refer to ![]() as the disruption probability
and
as the disruption probability
and ![]() as the recovery probability.
These are the transition probabilities for the DTMC. The up and down periods both constitute geometric processes,
and these processes are the discrete‐time analogues to the continuous‐time up/down processes in Section 9.2.1.
as the recovery probability.
These are the transition probabilities for the DTMC. The up and down periods both constitute geometric processes,
and these processes are the discrete‐time analogues to the continuous‐time up/down processes in Section 9.2.1.
Given the transition probabilities ![]() and
and ![]() , we can solve the steady‐state equations to derive the steady‐state probabilities of being in an up or down state as follows:
, we can solve the steady‐state equations to derive the steady‐state probabilities of being in an up or down state as follows:
It turns out to be convenient to work with a more granular Markov chain
that indicates not only whether the supplier is in an up or down period, but also how long the current down interval has lasted. In particular, state n in this Markov chain represents being in a down interval that has lasted for n consecutive periods. If ![]() , we are in an up period.
, we are in an up period.
Let ![]() be the steady‐state probability that the supplier is in a disruption that has lasted n periods. Furthermore, define
be the steady‐state probability that the supplier is in a disruption that has lasted n periods. Furthermore, define
![]() is the cdf of this process and represents the steady‐state probability that the supplier is in a disruption that has lasted n periods or fewer (including the probability that it is not disrupted at all). These probabilities are given explicitly in the following lemma, but often, we will ignore the explicit form of the probabilities and just use
is the cdf of this process and represents the steady‐state probability that the supplier is in a disruption that has lasted n periods or fewer (including the probability that it is not disrupted at all). These probabilities are given explicitly in the following lemma, but often, we will ignore the explicit form of the probabilities and just use ![]() and
and ![]() directly.
directly.
9.2.2.2 Form of the Optimal Policy
Our objective is to make inventory decisions to minimize the expected holding and stockout cost per period. What type of inventory policy should we use? It turns out that a base‐stock policy is optimal for this problem:
We omit the proof of Theorem 9.1; it follows from a much more general theorem proved by Song and Zipkin (1996). Note that a base‐stock policy works somewhat differently in this problem than in previous problems, since we might not be able to order up to the base‐stock level in every period—in particular, we can't order anything during down periods. So a base‐stock policy means that we order up to the base‐stock level during up periods and order nothing during down periods. The extra inventory during up periods is meant to protect us against down periods.
9.2.2.3 Expected Cost
Suppose the supplier is in state ![]() ; that is, an up period. If we order up to a base‐stock level of S at the beginning of the period, we incur a cost at the end of the period of
; that is, an up period. If we order up to a base‐stock level of S at the beginning of the period, we incur a cost at the end of the period of
In state ![]() , we incur a cost of
, we incur a cost of
and in general, we incur a cost of
in state n, for ![]() .
.
Therefore, the expected holding and stockout costs per period can be expressed as a function of S as follows:
9.2.2.4 Optimal Solution
Normally, we would find the optimal S by taking a derivative of ![]() , but since S is discrete (by Lemma 9.2), we need to use a finite difference
instead, as we did for the newsvendor problem with a discrete demand distribution in Section 4.3.2.8. In particular,
, but since S is discrete (by Lemma 9.2), we need to use a finite difference
instead, as we did for the newsvendor problem with a discrete demand distribution in Section 4.3.2.8. In particular, ![]() is the smallest S that is an integer multiple of d such that
is the smallest S that is an integer multiple of d such that ![]() , where
, where
(In Section 4.3.2.8, we defined ![]() as
as ![]() , but here, since S can only take on values that are multiples of d, it's sufficient to define
, but here, since S can only take on values that are multiples of d, it's sufficient to define ![]() as in 9.15.)
as in 9.15.)

Now,

and

Therefore,

where F is as defined in 9.10. Then ![]() is the smallest multiple of d such that
is the smallest multiple of d such that
where ![]() is interpreted as the smallest n such that
is interpreted as the smallest n such that ![]() . Interpreted this way,
. Interpreted this way, ![]() is an integer for all
is an integer for all ![]() , the right‐hand side of 9.17 is automatically a multiple of d, and we can drop the “smallest multiple of d” language and replace the inequality in 9.17 with an equality.
, the right‐hand side of 9.17 is automatically a multiple of d, and we can drop the “smallest multiple of d” language and replace the inequality in 9.17 with an equality.
We have now proved the following:
Notice that the optimal base‐stock level under supply uncertainty has a very similar structure to that under demand uncertainty, as given in 9.7. First, it uses the familiar newsvendor critical ratio
![]() , but here the inverse cdf
, but here the inverse cdf ![]() refers not to the demand distribution but to the supply distribution.
refers not to the demand distribution but to the supply distribution.
Second, the right‐hand side of 9.18 has a natural cycle stock–safety stock interpretation, just like in the demand uncertainty case. Here, d is the cycle stock
—the inventory to meet this period's demand—and ![]() , where
, where ![]() , is the safety stock
—the inventory to protect against uncertainty (in this case, supply uncertainty).
1
, is the safety stock
—the inventory to protect against uncertainty (in this case, supply uncertainty).
1
Just like in the demand uncertainty case, the optimal solution specifies what fractile of the distribution we should protect against. Here, we should have enough inventory to protect against any disruption whose length is no more than ![]() periods. The probability of a given period being in a disruption that has lasted longer than this is
periods. The probability of a given period being in a disruption that has lasted longer than this is ![]() , so, as in the demand uncertainty case, the type‐1 service level
is given by
, so, as in the demand uncertainty case, the type‐1 service level
is given by ![]() . As usual, the base‐stock level increases with p and decreases
with h.
. As usual, the base‐stock level increases with p and decreases
with h.
9.3 Inventory Models with Yield Uncertainty
In some cases, the number of items received from the supplier may not equal the number ordered. This may happen because of stockouts or machine failures at the supplier, or because the production process is subject to defects. The quantity actually received is called the yield. If the yield is deterministic—e.g., we always receive 80% of our order size—then the problem is easy: we just multiply our order size by ![]() . More commonly, however, there is a significant amount of uncertainty in the yield. The optimal solution under yield uncertainty
generally involves increasing the order quantity, as under imperfect but deterministic yield, but it should account for the variability in yield, not just the mean—just as in the case of demand uncertainty.
. More commonly, however, there is a significant amount of uncertainty in the yield. The optimal solution under yield uncertainty
generally involves increasing the order quantity, as under imperfect but deterministic yield, but it should account for the variability in yield, not just the mean—just as in the case of demand uncertainty.
In the sources of yield uncertainty mentioned above, we'd expect that the actual yield should always be less than or equal to the order quantity—we shouldn't receive more than we order. But yield uncertainty can also occur in batch production processes—e.g., for chemicals or pharmaceuticals—or in agriculture. In this case, it's not a matter of items being “defective,” but rather of not knowing in advance precisely how much usable product will result from the process. The amount received may therefore be more than the amount expected, and we can't necessarily place an upper bound on the yield.
In this section, we consider how to set inventory levels under yield uncertainty. As in Section 9.2, we consider both a continuous‐review setting, based on the EOQ model, and a periodic‐review setting, based on the newsvendor problem. As before, we will assume that demand is deterministic.
There are many ways to model yield uncertainty. We will consider two that are intuitive and tractable.
The first is an additive yield uncertainty
model in which we assume that if an order of size Q is placed, then the yield (the amount received) equals ![]() . Y is a continuous random variable with pdf
. Y is a continuous random variable with pdf ![]() and cdf
and cdf ![]() . Y need not be normal, or even symmetric. Y might be bounded from above by 0 if the yield can never exceed the order quantity; in this case, it might have an point mass at 0 (otherwise, the yield would equal 100% with 0 probability). Typically, the yield distribution is truncated at
. Y need not be normal, or even symmetric. Y might be bounded from above by 0 if the yield can never exceed the order quantity; in this case, it might have an point mass at 0 (otherwise, the yield would equal 100% with 0 probability). Typically, the yield distribution is truncated at ![]() (since we can't receive a negative amount), but we'll use
(since we can't receive a negative amount), but we'll use ![]() as its lower bound, primarily because it's inconvenient to have the yield distribution depend on the order size.
as its lower bound, primarily because it's inconvenient to have the yield distribution depend on the order size.
The second approach is a multiplicative yield uncertainty
approach in which the yield is given as ![]() , where Z is a continuous, nonnegative random variable with pdf
, where Z is a continuous, nonnegative random variable with pdf ![]() and cdf
and cdf ![]() . Again, Z need not be symmetric. If the yield cannot exceed Q, then
. Again, Z need not be symmetric. If the yield cannot exceed Q, then ![]() .
.
In both cases, we assume that the yield distribution (![]() or
or ![]() ) does not depend on Q. This assumption may or may not be realistic; it is made primarily for mathematical convenience.
) does not depend on Q. This assumption may or may not be realistic; it is made primarily for mathematical convenience.
9.3.1 The EOQ Model with Yield Uncertainty
9.3.1.1 Problem Statement
The setup for this problem is just like the EOQ model, except that if an order is placed for Q units, the actual number of units received may differ from Q. Unlike the EOQD in Section 9.2.1, the supplier never experiences down intervals, so it's always possible to place an order, even if the quantity delivered falls short of the quantity ordered. That means that, unlike the EOQD, we never have stockouts in the EOQ with yield uncertainty. (See Figure 9.4.)

Figure 9.4 EOQ inventory curve with yield uncertainty.
As in the EOQD, we'll derive the expected cost per year as a function of Q using the renewal‐reward theorem . Here, we can define a renewal simply as an order. We need to derive expressions for the expected cost per cycle and the expected cycle length.
9.3.1.2 Additive Yield
Let's first consider the additive yield approach, in which the yield is given by ![]() . In each cycle, we place exactly one order, so the fixed order cost is given by K. The expected holding cost
is given by h times the area of one triangle in Figure 9.4, but these triangles have varying heights and widths. In particular, if the yield is
. In each cycle, we place exactly one order, so the fixed order cost is given by K. The expected holding cost
is given by h times the area of one triangle in Figure 9.4, but these triangles have varying heights and widths. In particular, if the yield is ![]() , then the holding cost is
, then the holding cost is ![]() . Therefore, the expected cost per cycle is given by
. Therefore, the expected cost per cycle is given by

The expected cycle length is given by
Using the renewal‐reward theorem (Theorem 4.7) , the total expected cost per year is then
![]() is clearly convex
with respect to Q, so we can find a minimum by setting its derivative to 0:
is clearly convex
with respect to Q, so we can find a minimum by setting its derivative to 0:

Note that if ![]() (i.e., the yield differs from the order quantity but is no longer uncertain), then the solution is equivalent to the classical EOQ solution shifted by
(i.e., the yield differs from the order quantity but is no longer uncertain), then the solution is equivalent to the classical EOQ solution shifted by ![]() —i.e., order
—i.e., order ![]() , but if we will always receive 20 units fewer than we order (
, but if we will always receive 20 units fewer than we order (![]() ), then add 20 units to our order. If, in addition
), then add 20 units to our order. If, in addition ![]() , then we have the EOQ solution precisely.
, then we have the EOQ solution precisely.
Notice also that the optimal solution does not depend on the distribution of Y, only its first two moments. The optimal order quantity increases with ![]() but decreases with
but decreases with ![]() , since we need to over‐order less if the additive term is
greater.
, since we need to over‐order less if the additive term is
greater.
9.3.1.3 Multiplicative Yield
Now consider the multiplicative yield approach, in which the yield is given by ![]() . In analogy to 9.19, the expected cost per cycle is
. In analogy to 9.19, the expected cost per cycle is
Similarly, the expected cycle length is ![]() , so the expected cost per year is
, so the expected cost per year is
Again, we take a derivative with respect to Q:

Similar to the additive yield case, the optimal solution reduces to the EOQ solution, scaled by ![]() , if
, if ![]() . If, in addition,
. If, in addition, ![]() , then we have the EOQ solution exactly.
, then we have the EOQ solution exactly.
Here, too, the optimal solution depends only on the first two moments of Z, not its distribution. As before, ![]() decreases with
decreases with ![]() , but here it also decreases with
, but here it also decreases with ![]() . This is somewhat strange behavior. The explanation lies in what Yano and Lee (1995) call the “portfolio effect,” which basically means that if the yield is very variable, it's preferable to use smaller batches to increase our chances of getting a “good” batch the
next time.
. This is somewhat strange behavior. The explanation lies in what Yano and Lee (1995) call the “portfolio effect,” which basically means that if the yield is very variable, it's preferable to use smaller batches to increase our chances of getting a “good” batch the
next time.
9.3.2 The Newsvendor Problem with Yield Uncertainty
9.3.2.1 Problem Statement
Next, we consider the same infinite‐horizon newsvendor‐type problem as in Section 9.2.2, except that the supplier suffers from yield uncertainty rather than disruptions. As before, we assume that the demand is deterministic and equal to d per period.
9.3.2.2 Additive Yield
If we choose a base‐stock level of S, then we have ![]() on hand after the shipment arrives but before demand is realized, and the inventory level at the end of the period is
on hand after the shipment arrives but before demand is realized, and the inventory level at the end of the period is ![]() . This inventory level is positive if
. This inventory level is positive if ![]() and negative otherwise. Therefore, the expected cost per period is given by
and negative otherwise. Therefore, the expected cost per period is given by
We can convert this to a newsvendor function by letting ![]() . (
. (![]() represents the safety stock:
the amount ordered in excess of the demand to protect against yield uncertainty.) Equation 9.26 can then be written as
represents the safety stock:
the amount ordered in excess of the demand to protect against yield uncertainty.) Equation 9.26 can then be written as
This equation is identical in form to (4.3) (but note the reversal of the cost coefficients). Therefore, using (4.17) we know that
so
Note that the critical ratio
has h in the numerator, not p. If ![]() (as is typical), and if
(as is typical), and if ![]() (as is also typical), then
(as is also typical), then ![]() , so 9.28 instructs us to order more than d to compensate for the yield uncertainty. (Even if
, so 9.28 instructs us to order more than d to compensate for the yield uncertainty. (Even if ![]() ,
, ![]() may still be negative, depending on
may still be negative, depending on ![]() .)
.)
If Y is normally distributed, then

since ![]() (C.11). Again,
(C.11). Again, ![]() decreases with
decreases with ![]() . If
. If ![]() , then
, then ![]() , so, like the EOQ model with additive yield
in Section 9.3.1.2,
, so, like the EOQ model with additive yield
in Section 9.3.1.2, ![]() increases with
increases with ![]() .
.
In both 9.28 and 9.29, the term subtracted from d is a newsvendor quantity ((4.17) or (4.24)) in which the probability distribution function models the supply uncertainty rather than the demand uncertainty (and the critical ratio is reversed).
9.3.2.3 Multiplicative Yield
We will only consider a single‐period version of the newsvendor problem with multiplicative yield. The multiperiod problem is much more difficult than the version with additive yield. This is because it is more difficult to calculate the inventory level after the shipment arrives but before the demand occurs. In the additive yield model, this simply equalled ![]() , but under multiplicative yield, it equals
, but under multiplicative yield, it equals ![]() , where x is the ending inventory level in the previous period. This dependence on the system state in the previous period complicates the multiperiod analysis significantly.
, where x is the ending inventory level in the previous period. This dependence on the system state in the previous period complicates the multiperiod analysis significantly.
In the single‐period model, assume that we begin with an inventory level of 0, and we order S units. The inventory level after the shipment arrives is therefore ![]() , where Z is the random variable representing the yield. The expected cost in the period is given by
, where Z is the random variable representing the yield. The expected cost in the period is given by
Taking the derivative using Leibniz's rule (C.49), we get

Moreover,
so ![]() is convex and the first‐order condition is sufficient. Setting
is convex and the first‐order condition is sufficient. Setting ![]() , we find that
, we find that ![]() satisfies
satisfies
or, using (C.70),
Unfortunately, there is no closed‐form expression for ![]() , but we can solve 9.32 or 9.33 numerically to get
, but we can solve 9.32 or 9.33 numerically to get ![]() .
.
9.4 A Multisupplier Model
In this section, we discuss a model by Dada et al. (2007) in which a newsvendor orders from multiple suppliers, some of which may be subject to supply uncertainty. The newsvendor's objective is to maximize its expected profit. Supply uncertainty is modeled in a very general way; disruptions, yield uncertainty, and many other forms of supply uncertainty are special cases. The model can be used to make ordering decisions, but also to answer qualitative questions about which suppliers will be preferred over which others.
This is a single‐period model. Therefore, the ordering decision is used to balance among the suppliers' uncertainties—that is, to choose a portfolio of suppliers and corresponding order quantities in order to achieve as close as possible to the desired total inventory for the current period. In contrast, the disruption and yield uncertainty models in Sections 9.2 and 9.3 use the ordering decision to obtain inventory that can be used to buffer against the uncertainty in future orders. In other words, the earlier models spread the supply risk temporally across orders, whereas the model in this section spreads the supply risk spatially across suppliers.
9.4.1 Problem Statement
We consider a newsvendor that faces stochastic demand
represented by a random variable D with pdf ![]() and cdf
and cdf ![]() . There are N suppliers available to the newsvendor, which may differ in terms of their supply uncertainty. If the newsvendor orders a quantity
. There are N suppliers available to the newsvendor, which may differ in terms of their supply uncertainty. If the newsvendor orders a quantity ![]() from supplier i, then the number of units supplier i will actually have available for the newsvendor is given by its production function,
from supplier i, then the number of units supplier i will actually have available for the newsvendor is given by its production function, ![]() , where
, where ![]() is a nonnegative random variable with pdf
is a nonnegative random variable with pdf ![]() and cdf
and cdf ![]() . The suppliers never supply more than the newsvendor orders. The actual amount delivered to the newsvendor, then, is
. The suppliers never supply more than the newsvendor orders. The actual amount delivered to the newsvendor, then, is ![]() . We will often drop the arguments and just write or
. We will often drop the arguments and just write or ![]() or
or ![]() .
.
We assume the ![]() are independent. We also assume that the
are independent. We also assume that the ![]() are differentiable and that
are differentiable and that ![]() (so ordering one additional unit results in no more than one additional unit being available).
(so ordering one additional unit results in no more than one additional unit being available).
In some cases, the production function depends on the order quantity—for example, in the case of additive or multiplicative yield. We call these endogenous production functions. In contrast, exogenous production functions do not depend on the order quantity—disruptions are an example. If supplier i has an exogenous production function, then ![]() for all
for all ![]() and
and ![]() .
.
We say that supplier i is perfectly reliable if there is no chance that the supplier will deliver less than the newsvendor ordered from it, and unreliable if there is some possibility that the supplier will deliver less than ordered. In other words, i is perfectly reliable if ![]() , and unreliable if
, and unreliable if ![]() .
.
The production function is a very flexible construct, which is capable of modeling many forms of supply uncertainty. For example:
-
Perfect reliability:
 and
and  , regardless of
  . In this case, we have
  .
. -
Disruptions:
 ,
where
,
where  with some probability and
  with 1 minus that probability, for large M.
 -
Capacity uncertainty:
 ,
where
,
where  is a random variable with a given distribution.
 -
Multiplicative yield uncertainty:
 ,
where
,
where  is a random variable with a given distribution with support in
  .
. -
Additive yield uncertainty:
 ,
where
,
where  is a nonnegative random variable with a given distribution. (The
  is required to ensure that the number of available units is nonnegative.)
Note that the first three examples use exogenous production functions (in fact, the first example is a special case in which ![]() is degenerate, i.e., the supply is deterministic), while the last two use endogenous functions.
is degenerate, i.e., the supply is deterministic), while the last two use endogenous functions.
The newsvendor seeks to maximize its expected profit. (Most of the other models in this and earlier chapters assume the inventory manager wishes to minimize the expected cost, but the two are mathematically equivalent.) We will model the cost and revenue parameters explicitly, similar to the “explicit” newsvendor formulation in Section 4.3.2.4.
Each unit that supplier i delivers to the newsvendor costs the newsvendor ![]() . (Note that this cost is charged based on the number of units delivered, not the number ordered.) We assume the suppliers are sorted so that
. (Note that this cost is charged based on the number of units delivered, not the number ordered.) We assume the suppliers are sorted so that
The newsvendor earns a revenue of ![]() for each unit that it sells. Unmet demands incur a stockout cost
of
for each unit that it sells. Unmet demands incur a stockout cost
of ![]() in addition to the lost profit (e.g.,
in addition to the lost profit (e.g., ![]() is a loss‐of‐goodwill cost)
. Excess inventory may be salvaged
to earn a revenue of v (with
is a loss‐of‐goodwill cost)
. Excess inventory may be salvaged
to earn a revenue of v (with ![]() ).
).
9.4.2 Expected Profit
Suppose we order only from supplier i. Then the underage cost per unit of unmet demand is ![]() and the overage cost per unit of excess inventory is
and the overage cost per unit of excess inventory is ![]() . The critical ratio
is therefore
. The critical ratio
is therefore ![]() , which we denote
, which we denote ![]() . Note that this is identical to the critical ratio in (4.21) for the explicit formulation of the classical newsvendor problem, except that there is no additional holding cost h. By 9.34, we have
. Note that this is identical to the critical ratio in (4.21) for the explicit formulation of the classical newsvendor problem, except that there is no additional holding cost h. By 9.34, we have
Let ![]() be the vector of order quantities. Then the newsvendor's expected profit as a function of
be the vector of order quantities. Then the newsvendor's expected profit as a function of ![]() , denoted
, denoted ![]() , is
, is

where ![]() is the vector of random variables
is the vector of random variables ![]() and
and ![]() is the total quantity delivered by all suppliers. Note that although
is the total quantity delivered by all suppliers. Note that although ![]() does not appear explicitly inside the expectation in 9.36, it is still there, since
does not appear explicitly inside the expectation in 9.36, it is still there, since ![]() and
and ![]() depend on it.
depend on it.
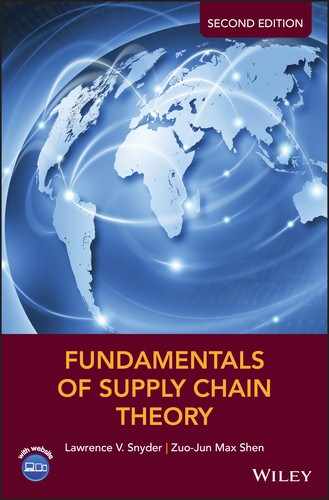
One can show (see Problem 9.18) that


The terms ![]() and
and ![]() are constants and can be ignored without changing the function's optimizers. Therefore, we will work with the following modified expected profit function, denoted with a tilde:
are constants and can be ignored without changing the function's optimizers. Therefore, we will work with the following modified expected profit function, denoted with a tilde:

Below, it will be convenient to separate out the parts of ![]() that correspond to a given supplier i from those that do not. To that end, let
that correspond to a given supplier i from those that do not. To that end, let ![]() be the total quantity delivered by all suppliers except i. Then for any i,
be the total quantity delivered by all suppliers except i. Then for any i,

where the notation ![]() means the sum over all
means the sum over all ![]() excluding
excluding ![]() . One can interpret 9.40 as something analogous to a standard newsvendor objective function with a single ordering decision,
. One can interpret 9.40 as something analogous to a standard newsvendor objective function with a single ordering decision, ![]() , by treating the newsvendor's demand as
, by treating the newsvendor's demand as ![]() (which, in 9.40, is the remaining demand after the other suppliers' delivered units are used up). The third term is a constant (with respect to
(which, in 9.40, is the remaining demand after the other suppliers' delivered units are used up). The third term is a constant (with respect to ![]() ). If one multiplies 9.40 by
). If one multiplies 9.40 by ![]() to convert it to a cost function, it takes the form of (4.12).
to convert it to a cost function, it takes the form of (4.12).
Therefore, we will consider the following optimization problem:
In the objective function 9.41, ![]() can be written as in 9.39 or 9.40.
can be written as in 9.39 or 9.40.
9.4.3 Optimality Conditions
The objective function ![]() is not, in general, concave.
This can make it difficult to find the optimal order quantities. Nevertheless, the model itself still provides plenty of structure to enable us to draw interesting conclusions and insights.
is not, in general, concave.
This can make it difficult to find the optimal order quantities. Nevertheless, the model itself still provides plenty of structure to enable us to draw interesting conclusions and insights.
We can rewrite the objective function using ![]() , the complementary loss function
corresponding to the demand distribution (see (4.5)):
, the complementary loss function
corresponding to the demand distribution (see (4.5)):
Under some fairly mild conditions on the random variables and the production functions, ![]() is differentiable. (See Dada et al. (2007) for details.) Let
is differentiable. (See Dada et al. (2007) for details.) Let
(Throughout, we will use the prime symbol ![]() to denote (partial) differentiation with respect to
to denote (partial) differentiation with respect to ![]() .) Then from 9.43, we get the following optimality condition:
.) Then from 9.43, we get the following optimality condition:
where ![]() is the marginal quantity delivered by supplier i, that is,
is the marginal quantity delivered by supplier i, that is,

(![]() is not differentiable at
is not differentiable at ![]() , but we will write
, but we will write ![]() nevertheless.) In 9.44, we use the derivative of
nevertheless.) In 9.44, we use the derivative of ![]() from (C.16), the chain rule, and the fact that the third term of 9.43 is independent of
from (C.16), the chain rule, and the fact that the third term of 9.43 is independent of ![]() .
.
Any optimal solution ![]() satisfies the following KKT
conditions:
satisfies the following KKT
conditions:
These are necessary conditions, but they are not sufficient unless ![]() happens to be
concave.
happens to be
concave.
Suppose ![]() ; then by 9.48,
; then by 9.48, ![]() —that is,
—that is,
In other words, we should choose ![]() so that the resulting total delivery quantity yields a service rate that, after scaling by constants that reflect supplier i's unreliability, equals the critical ratio.
In the special cases in Example 9.8, these constants equal 1, but in general they need not.
so that the resulting total delivery quantity yields a service rate that, after scaling by constants that reflect supplier i's unreliability, equals the critical ratio.
In the special cases in Example 9.8, these constants equal 1, but in general they need not.
9.4.4 Supplier Selection
In this section, we discuss some properties of the optimal suppliers to choose from among the available suppliers ![]() . The main insight from this analysis is that cost, rather than reliability, is the primary driver for supplier selection.
. The main insight from this analysis is that cost, rather than reliability, is the primary driver for supplier selection.
Let ![]() be the type‐1 service level (see Section 4.3.4.2)
resulting from the order‐quantity vector
be the type‐1 service level (see Section 4.3.4.2)
resulting from the order‐quantity vector ![]() ; i.e.,
; i.e.,
Let ![]() . The following lemma establishes a relationship between the overall service level and the critical ratio for supplier i, based on the order quantity for supplier i.
. The following lemma establishes a relationship between the overall service level and the critical ratio for supplier i, based on the order quantity for supplier i.
If supplier i is perfectly reliable, then Lemma 9.3 says that ![]() since
since ![]() . In other words, if we order from a perfectly reliable supplier, then the overall service level is exactly equal to the service level in the classical newsvendor problem.
. In other words, if we order from a perfectly reliable supplier, then the overall service level is exactly equal to the service level in the classical newsvendor problem.
Theorem 9.3 says that the newsvendor with unreliable suppliers orders more than the classical newsvendor (because ![]() and
and ![]() is increasing) but provides worse service to its customers.
is increasing) but provides worse service to its customers.
We say that supplier i is active if ![]() and inactive otherwise. The next theorem gives conditions under which we know for sure that a given supplier will be inactive, given the status of lower‐cost suppliers.
and inactive otherwise. The next theorem gives conditions under which we know for sure that a given supplier will be inactive, given the status of lower‐cost suppliers.
Part (a) says that if a given supplier is inactive, then all more expensive suppliers are inactive as well. In other words, cost, not reliability, is the primary driver when choosing suppliers, since in the optimal solution, the n least expensive suppliers will be active (for some n), and no others. On the other hand, reliability is not completely irrelevant, since, according to part (b), if there is a perfectly reliable supplier i available, then all more expensive suppliers are inactive, whether i is active or not. ![]() is a proxy for reliability: If
is a proxy for reliability: If ![]() , then i is perfectly reliable, since every additional unit ordered results in exactly 1 additional unit received; and the smaller
, then i is perfectly reliable, since every additional unit ordered results in exactly 1 additional unit received; and the smaller ![]() is, the less inventory we receive for each additional unit ordered from supplier i. Therefore, part (c) gives us a hybrid measure of a supplier's quality: If
is, the less inventory we receive for each additional unit ordered from supplier i. Therefore, part (c) gives us a hybrid measure of a supplier's quality: If ![]() is close to 1, then supplier i is fairly reliable, and if
is close to 1, then supplier i is fairly reliable, and if ![]() is close to 1, then supplier i is fairly inexpensive.
is close to 1, then supplier i is fairly inexpensive.
Taken together, the three parts of the theorem say that we activate suppliers in order of cost until we activate a supplier i either that is perfectly reliable or that has a sufficiently good combination of reliability and cost. Once we find such a supplier, it becomes active but all more expensive suppliers are inactive.
By Lemma 9.3(b), if supplier i is perfectly reliable and active, then the overall service level
equals ![]() , the optimal service level from the newsvendor problem in which supplier i is the sole, perfectly reliable, supplier. In other words, if there is an active, perfectly reliable supplier, then it is that supplier's role to make up the difference in the service level provided by the unreliable suppliers, bringing it up to
, the optimal service level from the newsvendor problem in which supplier i is the sole, perfectly reliable, supplier. In other words, if there is an active, perfectly reliable supplier, then it is that supplier's role to make up the difference in the service level provided by the unreliable suppliers, bringing it up to ![]() . If the unreliable suppliers' costs or reliabilities changed, their respective optimal order quantities would change, and
. If the unreliable suppliers' costs or reliabilities changed, their respective optimal order quantities would change, and ![]() would adjust to maintain a service level of
would adjust to maintain a service level of ![]() .
.
Suppose there is an expensive, unreliable supplier j that is inactive because there is a cheaper supplier i that satisfies the conditions in Theorem 9.4(b) or (c), i.e., that is perfectly reliable or for which ![]() . Then another implication of these results is that supplier j cannot gain activation by making itself more reliable, because doing so will not change the fact that supplier i that satisfies the conditions in Theorem 9.4(b) or (c), but it can gain activation by making itself less expensive (thus changing the sort order so that it is preferred over i).
. Then another implication of these results is that supplier j cannot gain activation by making itself more reliable, because doing so will not change the fact that supplier i that satisfies the conditions in Theorem 9.4(b) or (c), but it can gain activation by making itself less expensive (thus changing the sort order so that it is preferred over i).
9.4.5 Closing Thoughts
The results discussed above suggest that if a newsvendor's suppliers differ in terms of both cost and reliability, cost generally takes precedence over reliability when selecting suppliers. We rank the suppliers in terms of cost, and then start placing orders, supplier by supplier. As the total order quantity increases, so does ![]() . We continue adding suppliers until we reach a supplier j that is either perfectly reliable (by Theorem 9.4) or for which
. We continue adding suppliers until we reach a supplier j that is either perfectly reliable (by Theorem 9.4) or for which ![]() (by Lemma 9.3). The actual order quantities from each supplier,
(by Lemma 9.3). The actual order quantities from each supplier, ![]() , must be found using numerical optimization, except in special cases. The overall service level attained by the optimal solution is no greater than the service level that would be attained if the newsvendor had only a single, perfectly reliable supplier, with supplier 1's costs (by Theorem 9.3).
, must be found using numerical optimization, except in special cases. The overall service level attained by the optimal solution is no greater than the service level that would be attained if the newsvendor had only a single, perfectly reliable supplier, with supplier 1's costs (by Theorem 9.3).
This analysis suggests that an expensive supplier cannot gain activation (i.e., cannot convince the newsvendor to give it a nonzero order quantity) by improving its reliability, because reliability does not affect the ranking by ![]() . An expensive supplier can only gain activation by improving its cost. In contrast, an unreliable supplier can gain activation by improving its cost, even if it remains unreliable. Once a supplier is active, however, it can increase its share of the total order by improving its cost and/or
reliability.
. An expensive supplier can only gain activation by improving its cost. In contrast, an unreliable supplier can gain activation by improving its cost, even if it remains unreliable. Once a supplier is active, however, it can increase its share of the total order by improving its cost and/or
reliability.
9.5 The Risk‐Diversification Effect
9.5.1 Problem Statement
Consider the N‐DC system described in Section 7.2, except that now the demand is deterministic and equal to d per period (![]() ,
, ![]() for all i) but the supply may be disrupted. All DCs follow a periodic‐review
base‐stock policy,
as in Section 9.2.2. Disruptions follow the same two‐state Markov process
described in Section 9.2.2, with disruption probability
for all i) but the supply may be disrupted. All DCs follow a periodic‐review
base‐stock policy,
as in Section 9.2.2. Disruptions follow the same two‐state Markov process
described in Section 9.2.2, with disruption probability
![]() and recovery probability
and recovery probability ![]() . As before,
. As before, ![]() is the pmf of the disruption process and
is the pmf of the disruption process and ![]() is the cdf.
is the cdf.
The central question is, would it be preferable to consolidate the N DCs into a single DC? That is, is a centralized system preferable to a decentralized one? It turns out that the decentralized system is preferable in this case, but not because it has a lower expected cost. In fact, the two systems have the same expected cost, but the decentralized system has a lower variance. Therefore, risk‐averse decision makers would prefer the decentralized system.
This phenomenon—whereby the cost variance (but not the mean cost) is smaller when inventory is held at a decentralized set of locations—is called the risk‐diversification effect. Intuitively, it occurs because a given DC (or its portion of the central DC) is disrupted the same number of times, on average, in both systems, but disruptions are more severe in the centralized system. The supply chain benefits by not having all its eggs in one basket. The risk‐diversification effect was first described by Snyder and Shen (2006), who demonstrated it using simulation; the theoretical analysis in this section is based on Schmitt et al. (2015).
Note the parallels to the risk‐pooling effect: Whereas the risk‐pooling effect says that the mean cost (but not the variance (Schmitt et al., 2015)) is lower in a centralized system under demand uncertainty, the risk‐diversification effect says that the cost variance is lower (and the mean cost is equal) in a decentralized system under supply uncertainty.
In fact, Snyder and Shen (2006) comment that supply uncertainty (in the form of disruptions) often has a mirror‐image effect in relation to demand uncertainty, and that the optimal strategy under one type of uncertainty is often the exact opposite of that under the other type of uncertainty. The risk‐diversification effect is an example of this mirror‐image phenomenon, in the sense that supply chains under supply uncertainty behave in the opposite way to the ways we've observed them behaving previously, under demand uncertainty.
9.5.2 Notation
Let
be the cost in a given period in a single‐stage system if we use a base‐stock level of S and are in the nth period of a disruption (![]() ). Then from 9.14,
). Then from 9.14,
Let ![]() and
and ![]() be the mean and variance of the optimal cost:
be the mean and variance of the optimal cost:
where the expectation and variance are taken over the disruption state, n. We'll use subscripts D and C to refer to the costs in the decentralized and centralized systems, respectively, and no subscript when we're discussing a single‐stage system. Asterisks denote optimal solutions.
9.5.3 Optimal Solution
The optimal base‐stock level for a single‐stage newsvendor system with disruptions is given by Theorem 9.2:
(Remember that ![]() is interpreted as the smallest n such that
is interpreted as the smallest n such that ![]() .)
.)
Now, in the decentralized system, each DC acts like a single‐stage system, so the optimal base‐stock level at each DC is ![]() , where
, where ![]() is given by 9.55. In the centralized system, the warehouse acts as a single stage facing a demand of
is given by 9.55. In the centralized system, the warehouse acts as a single stage facing a demand of ![]() . Therefore, its optimal base‐stock level is
. Therefore, its optimal base‐stock level is
Thus, the total inventory is the same in both the centralized and decentralized systems. (In contrast, the total inventory is smaller in the centralized system under the risk‐pooling effect,
assuming ![]() .)
.)
9.5.4 Mean and Variance of Optimal Cost
Next, we examine the mean and variance of the cost when we use the optimal base‐stock levels in each system. In the decentralized system, since each DC acts like a single‐stage system, the total expected cost is just N times the total expected cost in a single‐stage system: ![]() . In the centralized system, the optimal cost at the warehouse is obtained by substituting
. In the centralized system, the optimal cost at the warehouse is obtained by substituting ![]() in place of S and
in place of S and ![]() in place of d in 9.14:
in place of d in 9.14:

Therefore, the expected cost is the same in the centralized and decentralized systems when we set the base‐stock levels optimally in each. In both systems, each DC experiences disruption‐related stockouts in the same percentage of periods. Moreover, during nondisrupted periods, the two systems have the same amount of inventory. Therefore, the optimal expected cost is the same in both systems.
Rather than improving the mean cost, decentralization improves the cost variance. Intuitively, this is because disruptions in the centralized system are less frequent but more severe, and therefore, they cause greater variability. To prove this mathematically, first note that
because the decentralized system consists of N individual single‐stage systems. Recall that ![]() and note that, for a single‐stage system,
and note that, for a single‐stage system,
Similarly, in the centralized system,

Then the variance in the centralized system is given by

Therefore, the variance is smaller in the decentralized system—this is the risk‐diversification effect. We summarize the preceding results in the following theorem:
9.5.5 Supply Disruptions and Stochastic Demand
Suppose now that demand is uncertain, as in Section 7.2. Disruptions are also still present, as in the preceding analysis.
Under demand uncertainty, the risk‐pooling effect says that centralization is preferable, while under supply uncertainty, the risk‐diversification effect says that decentralization is preferable. So, if both types of uncertainty are present, which strategy is better? We cannot answer this question analytically since the expected cost function cannot be optimized in closed form for either system. Instead, we evaluate the question numerically.
Most decision makers are risk averse—they are willing to sacrifice a certain amount of expected cost in order to reduce the variance of the cost. One way of modeling risk aversion is using a mean–variance objective, popularized by Markowitz in the 1950s:
where ![]() is a constant. If
is a constant. If ![]() is small, then the decision maker is fairly risk neutral; the larger
is small, then the decision maker is fairly risk neutral; the larger ![]() is, the more risk‐averse the decision maker is. Typically
is, the more risk‐averse the decision maker is. Typically ![]() is less than, say, 0.05.
is less than, say, 0.05.
One can write out ![]() and
and ![]() for the systems with disruptions and demand uncertainty, but we omit the formulas here. Schmitt et al. (2015) perform a computational study to determine which system is preferable to the risk‐averse decision maker. They numerically optimize 9.60 for both the centralized and decentralized systems and determine which system gives the smaller optimal objective value.
for the systems with disruptions and demand uncertainty, but we omit the formulas here. Schmitt et al. (2015) perform a computational study to determine which system is preferable to the risk‐averse decision maker. They numerically optimize 9.60 for both the centralized and decentralized systems and determine which system gives the smaller optimal objective value.
They find that the decentralized system is almost always optimal, i.e., that the risk‐diversification effect almost always trumps the risk‐pooling effect. For example, under a given set of problem parameters, the decentralized system is optimal whenever ![]() and
and ![]() —in other words, whenever the decision maker is even slightly risk averse and the required service level is at
least 50%.
—in other words, whenever the decision maker is even slightly risk averse and the required service level is at
least 50%.
9.6 A Facility Location Model with Disruptions
9.6.1 Introduction
The uncapacitated fixed‐charge location problem (UFLP) introduced in Section 8.2 chooses facility locations and customer assignments to minimize fixed and transportation costs. The model assumes that facilities always operate as planned. However, facilities are occasionally disrupted by weather conditions, labor actions, or natural disasters. These disruptions may result in increased costs as customers previously served by these facilities must now be served by more distant ones. The model presented in this section chooses facility locations to minimize the expected cost after accounting for disruptions. We call the ability of a system to perform well even when parts of the system are disrupted the reliability of the system. Our goal is to choose facility locations that are both inexpensive and reliable.
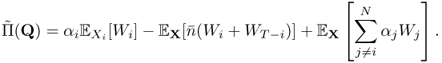
Figure 9.8 shows the optimal UFLP solution for a data set consisting of the capitals of the lower 48 United States plus Washington, DC (Daskin, 1995). In this solution, the fixed cost is $348,000, and the transportation cost is $509,000. Now suppose that the facility in Sacramento, CA, is disrupted. During the disruption, Sacramento's customers are re‐routed to their nearest open facilities, in Springfield, IL, and Austin, TX (Figure 9.9). This new solution has a transportation cost of $1,081,000, an increase of 112%.

Figure 9.8 UFLP solution for 49‐node data set..
Reprinted by permission, Snyder and Daskin, Reliability models for facility location: The expected failure cost case, Transportation Science, 39(3), 2005, 400–416. ©2005, the Institute for Operations Research and the Management Sciences, 7240 Parkway Drive, Suite 300, Hanover, MD 21076 USA

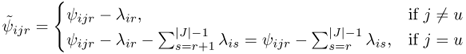
Figure 9.9 UFLP solution for 49‐node data set, after disruption of facility in Sacramento..
Reprinted by permission, Snyder and Daskin, Reliability models for facility location: The expected failure cost case, Transportation Science, 39(3), 2005, 400–416. ©2005, the Institute for Operations Research and the Management Sciences, 7240 Parkway Drive, Suite 300, Hanover, MD 21076 USA
Table 9.3 lists the disruption costs (the transportation cost when a site is disrupted) of the five optimal DCs, as well as their assigned demands. From the table, it is evident that the reliability of a facility can depend either on its distance from other facilities or on the demand it serves, or both. For example, Sacramento, CA, serves a relatively small portion of the total demand, but it has a large disruption cost because its nearest “backup” facilities are far away. Harrisburg, PA, also has a high disruption cost, even though it is relatively close to two good backup facilities; the high disruption cost occurs because Harrisburg serves one‐third of the total demand. Springfield, IL, is the second‐largest facility in terms of demand served, but its disruption cost is much smaller because it is centrally located, close to good backup facilities.
Table 9.3 Disruption costs for optimal DCs. Reprinted by permission, Snyder and Daskin, Reliability models for facility location: The expected failure cost case, Transportation Science, 39(3), 2005, 400–416. ©2005, the Institute for Operations Research and the Management Sciences, 7240 Parkway Drive, Suite 300, Hanover, MD 21076 USA.
| Location | % Demand Served | Disruption Cost | % Increase |
| Sacramento, CA | 19 | 1,081,229 | 112 |
| Harrisburg, PA | 33 | 917,332 | 80 |
| Springfield, IL | 22 | 696,947 | 37 |
| Montgomery, AL | 16 | 639,631 | 26 |
| Austin, TX | 10 | 636,858 | 25 |
| Transportation cost w/no disruptions | 508,858 | 0 |
It is possible to choose facility locations that are more resilient to disruptions—that is, that have lower disruption costs. For example, suppose we locate facilities in the capitals of CA, NY, TX, PA, OH, AL, OR, and IA. (See Figure 9.10.) In this solution, every disruption cost is less than or equal to $640,000. On the other hand, three additional facilities are used in this solution. Is the improvement in reliability worth the increased facility cost? One of the goals of the model in this section is to demonstrate that the answer is often “yes.” In other words, substantial improvements in reliability can often be obtained without large increases in the UFLP cost. This means that by taking reliability into account at design time, one can find a near‐optimal UFLP solution that has much better reliability.
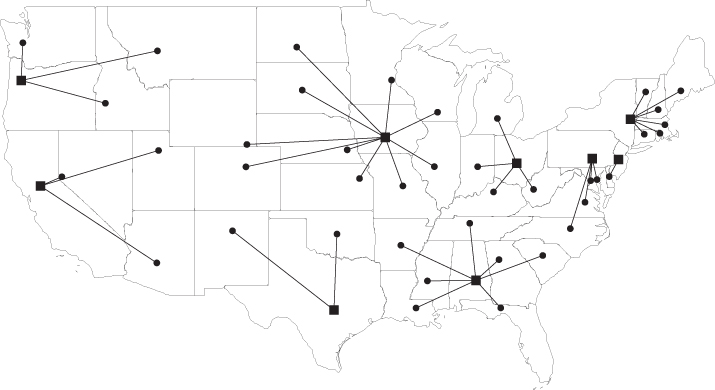
Figure 9.10 Reliable solution for 49‐node data set.
We will present an extension of the UFLP that minimizes the expected postdisruption cost, given a certain probability that each facility is disrupted. Multiple facilities may be disrupted simultaneously. We refer to this model as the reliable fixed‐charge location problem (RFLP). The model we present is a simplified version of the model introduced by Snyder and Daskin (2005). A similar model was studied by Berman et al. (2007). For reviews on facility location models with disruptions, see Snyder et al. (2006) or Snyder and Daskin (2007).
9.6.2 Notation
As
in the UFLP, let I be the set of customers and J the set of potential facility sites. Let ![]() be the demand at customer i,
be the demand at customer i, ![]() the transportation cost from facility j to customer i, and
the transportation cost from facility j to customer i, and ![]() the fixed cost to open
facility j.
the fixed cost to open
facility j.
Each facility in J has the same probability q of being disrupted, which is interpreted as the long‐run fraction of time the facility is nonoperational. In some cases, q may be estimated based on historical data (e.g., for weather‐related disruptions), while in others q must be estimated subjectively (e.g., for disruptions due to labor strikes). We can assume that facility disruptions follow a two‐state Markov process, as in Section 9.2, but the exact disruption process is not important. It is important, however, that disruptions are statistically independent from facility to facility.
The assumption that every facility has the same disruption probability q is generally unrealistic, but it makes the model considerably easier to solve. Several approaches have been proposed for relaxing this assumption; see, e.g., Berman et al. (2007), Li and Ouyang (2010), Cui et al. (2010), Shen et al. (2011), and also Problem 9.23.
Associated with each customer i is a cost ![]() that represents the cost of not serving the customer—for example, if all open facilities are disrupted—per unit of demand.
that represents the cost of not serving the customer—for example, if all open facilities are disrupted—per unit of demand. ![]() may be a lost‐sales cost, or the cost of serving i by purchasing product from a competitor on an emergency basis. Instead of modeling this eventuality explicitly, we perform a modeling trick: We add an “emergency” facility u that cannot be disrupted and we force
may be a lost‐sales cost, or the cost of serving i by purchasing product from a competitor on an emergency basis. Instead of modeling this eventuality explicitly, we perform a modeling trick: We add an “emergency” facility u that cannot be disrupted and we force ![]() . This facility has fixed cost
. This facility has fixed cost ![]() and transportation cost
and transportation cost ![]() for every customer
for every customer ![]() . From this point forward, the set J is assumed to contain u, as well.
. From this point forward, the set J is assumed to contain u, as well.
The strategy behind the formulation of the RFLP is to assign each customer to a primary facility that will serve it under normal circumstances, as well as to a set of backup facilities that serve it when the primary facility is disrupted. Since multiple disruptions may occur simultaneously, each customer needs a first backup facility in case its primary facility is disrupted, a second backup facility in case its first backup is disrupted, and so on.
There are two sets of decision variables in this model:

A “level‐r” assignment is one for which there are r closer facilities that are open. If ![]() , this is a primary assignment; otherwise, it is a backup assignment. Each customer i has a level‐r assignment for each
, this is a primary assignment; otherwise, it is a backup assignment. Each customer i has a level‐r assignment for each ![]() , unless i is assigned to the emergency facility u at level s, where
, unless i is assigned to the emergency facility u at level s, where ![]() . In other words, customer i is assigned to one facility at level 0, another facility at level 1, and so on until i has been assigned to facility u at some level. If a customer is assigned to facility u at a level r, with
. In other words, customer i is assigned to one facility at level 0, another facility at level 1, and so on until i has been assigned to facility u at some level. If a customer is assigned to facility u at a level r, with ![]() , then it is preferable to lose that customer's demand than to serve it from the remaining facilities if the first r facilities have
failed.
, then it is preferable to lose that customer's demand than to serve it from the remaining facilities if the first r facilities have
failed.
9.6.3 Formulation
The objective function of the RFLP is given by

This expression calculates the fixed cost plus the expected transportation cost. Each customer i is served by its level‐r facility (call it j) if the r closer facilities are disrupted (this occurs with probability ![]() ) and if j itself is not disrupted (this occurs with probability
) and if j itself is not disrupted (this occurs with probability ![]() , unless
, unless ![]() , in which case it occurs with probability 1). For notational convenience, we define
, in which case it occurs with probability 1). For notational convenience, we define

Then the RFLP can be formulated as an IP as follows:


Constraints 9.62 require that for each customer i and each level r, either i is assigned to a level‐r facility or it is assigned to facility u at a level ![]() . (By convention we take
. (By convention we take ![]() if
if ![]() .) Constraints 9.63 prohibit an assignment to a facility that has not been opened. Constraints 9.64 prohibit a customer from being assigned to a given facility at more than one level. Constraint 9.65 requires the emergency facility u to be opened. Constraints 9.66 and 9.67 are integrality constraints.
.) Constraints 9.63 prohibit an assignment to a facility that has not been opened. Constraints 9.64 prohibit a customer from being assigned to a given facility at more than one level. Constraint 9.65 requires the emergency facility u to be opened. Constraints 9.66 and 9.67 are integrality constraints.
You may be wondering why there are no constraints requiring the assignments to occur in order of distance—that is, for a customer's level‐r facility to be closer than its level‐![]() ) facility. It turns out that this assignment strategy is always optimal, so it does not need to be enforced by constraints.
) facility. It turns out that this assignment strategy is always optimal, so it does not need to be enforced by constraints.
9.6.4 Lagrangian Relaxation
We solve (RFLP) by relaxing constraints 9.62 using Lagrangian relaxation. For given Lagrange multipliers ![]() , the subproblem is as follows:
, the subproblem is as follows:


The portion of the objective function 9.70 other than the fixed costs can be rewritten as follows:

Therefore, the objective function can be written as

where
For given ![]() , problem
, problem ![]() can be solved easily. Since the assignment constraints 9.62 have been relaxed, customer i may be assigned to zero, one, or more than one open facility at each level, but it may be assigned to a given facility at at most one level r. Suppose that facility j is opened. Customer i will be assigned to facility j at level r if
can be solved easily. Since the assignment constraints 9.62 have been relaxed, customer i may be assigned to zero, one, or more than one open facility at each level, but it may be assigned to a given facility at at most one level r. Suppose that facility j is opened. Customer i will be assigned to facility j at level r if ![]() and
and ![]() for all
for all ![]() . Therefore, the benefit of opening facility j is given by
. Therefore, the benefit of opening facility j is given by
Once the benefits ![]() have been computed for all j, we set
have been computed for all j, we set ![]() for the emergency facility u and for any j for which
for the emergency facility u and for any j for which ![]() ; we set
; we set ![]() if (1) facility j is open, (2)
if (1) facility j is open, (2) ![]() , and (3) r minimizes
, and (3) r minimizes ![]() for
for ![]() . The optimal objective value for
. The optimal objective value for ![]() is
is

and this provides a lower bound on the optimal objective value of (RFLP).
One can obtain upper bounds by first opening the facilities that are open in the solution to ![]() , then assigning customers to level‐r facilities in increasing order of distance. As in the UFLP, improvement heuristics (e.g., exchange heuristics) can be applied to improve the solution found.
, then assigning customers to level‐r facilities in increasing order of distance. As in the UFLP, improvement heuristics (e.g., exchange heuristics) can be applied to improve the solution found.
The Lagrange multipliers are updated using subgradient optimization in a manner very similar to that described in Section 8.2.3.5. If the procedure terminates without a provably optimal solution, branch‐and‐bound can be used to close the gap, as described in Section D.1.6.
9.6.5 Trade‐off Curves
The RFLP can alternately be modeled as a multiobjective optimization problem in which one objective represents the normal UFLP cost (ignoring disruptions) and the other objective represents the expected transportation cost (accounting for disruptions). Multiobjective optimization allows the decision maker to express her preference between the two objectives. For example, a firm that is used to thinking only about the classical UFLP objective may weight the problem toward this objective, while a firm that is very concerned about disruptions may favor the other objective.
The two objectives can be formulated as follows:

Objective ![]() calculates the classical UFLP cost of opening facilities and serving customers from their primary facilities. Objective
calculates the classical UFLP cost of opening facilities and serving customers from their primary facilities. Objective ![]() computes the expected transportation cost, accounting for both normal and disrupted modes. We can then replace the RFLP objective function 9.61 with
computes the expected transportation cost, accounting for both normal and disrupted modes. We can then replace the RFLP objective function 9.61 with
where ![]() is a parameter specified by the user,
is a parameter specified by the user, ![]() . Large values of
. Large values of ![]() place more emphasis on objective 1, small values on objective 2. (Setting
place more emphasis on objective 1, small values on objective 2. (Setting ![]() is equivalent to solving the UFLP.) The decision maker might select a single value of
is equivalent to solving the UFLP.) The decision maker might select a single value of ![]() , but more commonly, the goal is to generate the trade‐off curve
that depicts the relationship between the two objectives. In essence, the trade‐off curve (also known as the Pareto curve
or efficient frontier)
tells us how much of one objective we must sacrifice in order to improve the other objective.
, but more commonly, the goal is to generate the trade‐off curve
that depicts the relationship between the two objectives. In essence, the trade‐off curve (also known as the Pareto curve
or efficient frontier)
tells us how much of one objective we must sacrifice in order to improve the other objective.
How can we generate such a trade‐off curve? The brute‐force approach would be to simply solve the RFLP (with objective 9.77) for every value of ![]() between 0 and 1 in increments of, say, 0.001. But it is preferable to use a much more elegant and efficient approach called the weighting method.
We won't describe the details of this approach; see instead Cohon (1978).
between 0 and 1 in increments of, say, 0.001. But it is preferable to use a much more elegant and efficient approach called the weighting method.
We won't describe the details of this approach; see instead Cohon (1978).
The trade‐off curve for the 49‐node problem discussed in Section 9.6.1 is pictured in Figure 9.11. Each point represents a different solution to the RFLP, and the axes represent the two objectives. The left‐most point is the UFLP solution (![]() ). The left portion of the trade‐off curve is “steep,” indicating that large improvements in reliability can be attained with only small increases in the classical UFLP cost. For example, the third point on the trade‐off curve has a 3.1% increase in UFLP cost from the original UFLP solution but a 13.4% decrease in expected disruption cost, and the fourth point has a 7.3% increase in cost but a 26.5% decrease in expected disruption cost.
). The left portion of the trade‐off curve is “steep,” indicating that large improvements in reliability can be attained with only small increases in the classical UFLP cost. For example, the third point on the trade‐off curve has a 3.1% increase in UFLP cost from the original UFLP solution but a 13.4% decrease in expected disruption cost, and the fourth point has a 7.3% increase in cost but a 26.5% decrease in expected disruption cost.

Figure 9.11 Sample RFLP trade‐off curve..
Reprinted by permission, Snyder and Daskin, Reliability models for facility location: The expected failure cost case, Transportation Science, 39(3), 2005, 400–416. ©2005, the Institute for Operations Research and the Management Sciences, 7240 Parkway Drive, Suite 300, Hanover, MD 21076 USA
PROBLEMS
- 9.1 (Disruption‐Prone Bicycle Parts) A bicycle manufacturer buys a particular cable used in its bicycles from a single supplier located in South America. The manufacturer follows a periodic‐review base‐stock policy for its inventory of cables, placing an order with the supplier every week. The supplier occasionally experiences disruptions due to hurricanes, labor actions, and other events. These disruptions follow a Markov process with disruption probability
 and recovery probability
  . When not disrupted, the supplier's lead time is negligible. Cables are used by the manufacturer at a constant rate of 6000 per week. Inventory incurs a holding cost of $0.002 per cable per week. If the manufacturer runs out of cables, it must delay production, resulting in a cost that amounts to $0.05 per cable per week.
- On average, how many weeks per year is the supplier disrupted? On average, how long does each disruption last?
- What is the optimal base‐stock level for cables?
- 9.2 (Disruption‐Prone Appliance Parts) An appliance manufacturer buys a particular gasket used in its dishwashers from a single supplier located in Turkey. The manufacturer follows a periodic‐review base‐stock policy for its inventory of gaskets, placing an order with the supplier every week. The supplier occasionally experiences disruptions that follow a Markov process with disruption probability
 and recovery probability
  . When not disrupted, the supplier's lead time is negligible. Gaskets are used by the manufacturer at a constant rate of 2400 per week. Inventory incurs a holding cost of $0.55 per gasket per week. If the manufacturer runs out of gaskets, it must delay production, resulting in a cost that amounts to $2.75 per gasket per week.
- On average, how many weeks per year is the supplier disrupted? On average, how long does each disruption last?
- What is the optimal base‐stock level for gaskets?
- 9.3 (Stocking Latex Gloves) A university health clinic uses exactly 4 boxes of latex gloves per week and orders gloves once per week. It costs the clinic $0.10 per week to hold one box of gloves in inventory. If the clinic runs out of gloves before the end of the week, they must buy more gloves from a local pharmacy at a cost that is $0.50 greater per box than the cost their normal supplier charges.
The clinic's normal supplier of gloves is quite unreliable. In any period, there is a 50% chance that the supplier is disrupted and cannot ship any gloves. This probability is independent of whether the supplier was disrupted in the previous period; that is,
 . What is the optimal base‐stock level for the clinic to use when ordering gloves?
 - 9.4 (Random Yield for Steel) Return to Problem 3.1. Suppose that the amount of steel delivered by the supplier differs randomly from the order quantity, and the auto manufacturer must accept whatever quantity the supplier delivers. Let Q be the order quantity.
- Suppose the delivery quantity is given by
 , where
  . What is
  ?
? - Suppose the delivery quantity is given by
 , where
  . What is
  ?
?
- Suppose the delivery quantity is given by
- 9.5 (Staffing Truck Drivers) The US trucking industry
suffers from notoriously high employee turnover, with turnover rates often well in excess of 100% (Paz‐Frankel, 2006). This makes advance planning difficult since it is difficult to predict how many drivers will be available when needed. Suppose a trucking company needs 25 drivers every day. If the company asks S drivers to report to work on a given day, the number of drivers who actually show up is given by
 , where
  . Drivers who report to work but are not needed must still be paid their daily wage of $150. For each driver fewer than 25 that show up, the company will be unable to deliver a load, incurring a cost of $1200. Find
  , the optimal number of drivers to ask to report to work. (Fractional solutions are acceptable.) Also report
  , the optimal expected cost per day.
 - 9.6 (Simulating Truck‐Driver Staffing) Build a simulation model of the truck‐driver‐staffing problem in Problem 9.5. Simulate the system for at least 1000 periods and assume the company uses
 (which is not necessarily optimal). Report the expected cost per day. You may use Excel, MATLAB, or another package or language of your choice.
 - 9.7 (EOQD Approximation) Suppose
that, in the EOQD model of Section 9.2.1, we replace
 (a function of Q) with
(which is independent of Q). Let
 be the cost function that results from replacing
  with
with  in 9.5. It is known that
  is convex (you do not need to prove this).
- Prove that the derivative of
 is
is
- Prove that
 , the Q that minimizes
  , is given by
- Prove that the derivative of
- 9.8 (Implementing EOQD Approximation) Consider an instance of the EOQD with
 ,
,  ,
,  ,
,  ,
,  , and
, and  .
.- Find
 for this instance using optimization software of your choice. Report the expected cost,
  .
. - Consider the following heuristic for the EOQD:
- Set Q equal to the EOQ.
- Calculate
 using the current value of Q.
 - Find Q using 9.82 from Problem 9.7, setting
 equal to the current
  from step 2.
 - If Q has changed more than
 since the previous iteration (for fixed
  ), then go to 2; otherwise, stop.
 . Report the Q you found, its cost
  , and the percentage difference between
  and
and  from part (a).
- Find
- 9.9 (Optimal Cost for Base‐Stock Policy with Disruptions) In the base‐stock problem with disruptions discussed in Section 9.2.2, let R be the smallest n such that
 , where
  is as defined in 9.10. Prove that
and that equality holds if and only if
 .
. - 9.10 (Proof of Lemma 9.1) Prove Lemma 9.1.
- 9.11 (Disruptions = Stochastic Demand?)
- Develop a stochastic demand process that is equivalent to the stochastic supply process in the base‐stock model with disruptions from Section 9.2.2. In particular, formulate a demand distribution such that, if the demand is iid stochastic following your distribution but the supply is deterministic, the expected cost is equal to the expected cost given by 9.14, assuming we order up to the same S in every period. Prove that the two expected costs are equal. Make sure you specify both the possible values of the demand and the probability of each value, i.e., the pmf.
- In part (a) you proved that, under the optimal solution, the expected cost is the same in both models. Is the entire distribution of the random variable representing the cost also the same in both models?
- 9.12 (Newsvendor with Random Yield and Demand) The additive yield model in Section 9.3.2.2 assumes the demand is deterministic and equal to d. Suppose instead that the demand is given by a random variable
 . The yield, Y, continues to be random, with a normal distribution, and D and Y are independent. Show that we can solve this problem either by defining a new random variable that represents the “net demand” and using the classical newsvendor model, or by defining a new random variable that represents the “net yield” and using the model from Section 9.3.2.2. Show that these two approaches
are equivalent.
. The yield, Y, continues to be random, with a normal distribution, and D and Y are independent. Show that we can solve this problem either by defining a new random variable that represents the “net demand” and using the classical newsvendor model, or by defining a new random variable that represents the “net yield” and using the model from Section 9.3.2.2. Show that these two approaches
are equivalent. - 9.13 (Optimal Cost for EOQ with Additive Yield Uncertainty)
Prove that, in the EOQ model with additive yield uncertainty (Section 9.3.1.2), the optimal expected cost is given by

- 9.14 (Optimal Cost for EOQ with Multiplicative Yield Uncertainty) Prove that, in the EOQ model with multiplicative yield uncertainty (Section 9.3.1.3), the optimal expected cost is given by

- 9.15 (EOQ with Discrete Yield Uncertainty) Suppose that, in the EOQ models with additive and multiplicative yield uncertainty, Y and Z are discrete random variables rather than continuous ones, but that Q may still take continuous values. Show that the expected cost functions 9.22 and 9.24 remain the same, as do the optimal solutions 9.23 and 9.25.
- 9.16 (Production Functions) Provide appropriate definitions of
 (that is, of
  and
and  ) to model each of the forms of supplier unreliability listed below for the multisupplier newsvendor model of Section 9.4. In each case, assume that Y is a nonnegative random variable with known distribution.
- The supplier delivers either 90% of the order quantity, or Y, whichever is smaller.
- If the order is for fewer than Y units, the supplier will deliver the entire order quantity. If the order is for Y units or more, the supplier will deliver 50% of the order quantity.
- With probability
 , the supplier is down and cannot provide any product. With probability
  , the supplier is up. When the supplier is up, it delivers
  % of the order quantity, where
  and
and  .
.
- 9.17 (Multisupplier Model Example) Consider a four‐supplier instance of the multisupplier newsvendor model of Section 9.4. Let
 ,
,  ,
,  ,
,  ,
,  ,
,  , and
, and  . Let the demand D be distributed as
  . For each part below, choose supplier production functions
  (i.e., choose
  and
and  ),
),  , such that the optimal
  have the desired property, and argue clearly why your production functions produce
  with that property.
-
 and
and  . (This illustrates Theorem 9.4(a).)
 - One of the suppliers is perfectly reliable and, in the optimal solution, both the perfectly reliable supplier and another supplier are active. (This illustrates that, although Theorem 9.4(b) says that all suppliers that are more expensive than the perfectly reliable supplier must be inactive, cheaper suppliers may be active.)
- For some i and j with
 ,
,  and thus, by Theorem 9.4(c),
  .
.
-
- 9.18 (Expected Profit for Multisupplier Model) Prove that the newsvendor's expected profit is given by 9.37.
- 9.19 (Proof of Special Case of Lemma
9.3(b)) Prove Lemma 9.3(b) for the case in which supplier i has an exogenous production function; that is,
 .
. - 9.20 (Optimality Condition for Exogenous Supply) In the multisupplier model of Section 9.4, prove that, if supplier i has an exogenous production function and
 , then
where
 .
. - 9.21 (Service Level vs. Cost and Reliability)
Suppose there is only a single supplier, and assume it has an exogenous production function as defined in Section 9.4. Suppose further that the supplier's production function is characterized by a parameter
 , with
  , so that as
  increases, so does the supplier's reliability. (We'll omit the subscript 1 since there is only a single supplier.)
- Prove that
 increases with
  .
. - Prove that
 increases with
  .
.Hint: You may use 9.85.
- Prove that
- 9.22 (Proof of Theorem 9.6) Prove Theorem 9.6.
- 9.23 (Facility‐Dependent Disruption Probabilities)
Suppose we want each facility to have a different disruption probability
 in the RFLP model from Section 9.6. If we were to use similar logic as the RFLP, the objective function would become very messy since the
  terms would be replaced by a product of
  variables. Develop an alternate formulation for this problem in which the
  may be different for each j.
- Write out your formulation. Your formulation must be linear. Define any new notation that you introduce, and explain the objective function and each of the constraints in words.
- In a short paragraph, discuss the advantages and disadvantages of your formulation versus the original model.
- 9.24 (Time‐to‐Survive Model) Using the notation from Case Study 9.1, formulate the time‐to‐survive (TTS) model, which calculates the maximum amount of time the firm can last without losing demand when scenario s occurs. If you introduce any new notation, define it clearly. Explain the objective function and constraints in words.
