
9.2 The EM algorithm
9.2.1 The idea of the EM algorithm
A useful numerical technique which finds the posterior mode, that is, the value at which ![]() or equivalently
or equivalently ![]() is a maximum, but does not provide full information on the posterior distribution is the EM algorithm. We can exemplify this by an example on genetic linkage due to Rao (1973, Section 5g) quoted by Dempster et al. (1977), by Gelfand and Smith (1990) and by Tanner (1996, Section 4.1). We have observations
is a maximum, but does not provide full information on the posterior distribution is the EM algorithm. We can exemplify this by an example on genetic linkage due to Rao (1973, Section 5g) quoted by Dempster et al. (1977), by Gelfand and Smith (1990) and by Tanner (1996, Section 4.1). We have observations ![]() with cell probabilities
with cell probabilities
![]()
and we want to estimate η. The likelihood is then
![]()
What we do is to augment the data ![]() by adding further data
by adding further data ![]() to produce augmented data
to produce augmented data ![]() . It should be noted that to a considerable extent the distinction between parameters of a model and augmentations to the data is artificial (i.e. fictitious augmentations to the data can be regarded as parameters of a model). In the example under consideration, the augmentation consists simply in splitting the first cell into two cells with probabilities
. It should be noted that to a considerable extent the distinction between parameters of a model and augmentations to the data is artificial (i.e. fictitious augmentations to the data can be regarded as parameters of a model). In the example under consideration, the augmentation consists simply in splitting the first cell into two cells with probabilities ![]() and
and ![]() . The advantage of this is that the likelihood then takes the much simpler form
. The advantage of this is that the likelihood then takes the much simpler form
![]()
and if we take the standard reference prior Be(0, 0), then the posterior is a beta distribution
![]()
Not much in life is free, and in this case we have to pay for the greater simplicity of the model by estimating the split of x1 into y0 and y1. The EM algorithm for finding the posterior mode is an iterative method starting from some plausible guess ![]() for the value of η. At stage t, we suppose that the current guess is
for the value of η. At stage t, we suppose that the current guess is ![]() . Each stage has two steps. In the first, the E-step (expectation step), we compute
. Each stage has two steps. In the first, the E-step (expectation step), we compute
![]()
that is, the expectation of the log-likelihood function, the expectation being computed at ![]() , so that
, so that
![]()
In the second step, the M-step (the maximization step), we we find that value ![]() of η which maximizes
of η which maximizes ![]() . In this particular example as yi=xi for i> 1
. In this particular example as yi=xi for i> 1
![]()
For the M-step, we note that
![]()
and equating this to zero we deduce that
![]()
Since y1 has a binomial ![]() distribution with
distribution with
![]()
so that
![]()
the iteration becomes
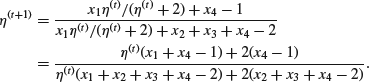
The values actually observed were x1=125, x2=18, x3=20, x4=34. We can then estimate η by iteration starting from, for example, ![]() and using
and using
![]()
In fact, the iteration will converge to the positive root of ![]() which is 0.630.
which is 0.630.
9.2.2 Why the EM algorithm works
We will first show that ![]() increases with t and, presuming that
increases with t and, presuming that ![]() converges to some limit
converges to some limit ![]() , then show that
, then show that ![]() at
at ![]() so that
so that ![]() will normally be the posterior mode.
will normally be the posterior mode.
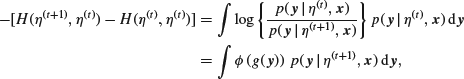
From the obvious equation ![]() considered conditional on
considered conditional on ![]() , it follows, on noting that
, it follows, on noting that ![]() includes
includes ![]() and hence
and hence ![]() , that
, that
![]()
Multiplying both sides by the density ![]() and integrating (noting that the left hand side does not depend on
and integrating (noting that the left hand side does not depend on ![]() ), we get for any fixed
), we get for any fixed ![]()

(we note that K clearly does not depend on η). Taking ![]() , we get
, we get
![]()
Now ![]() because of the way in which we chose
because of the way in which we chose ![]() . Moreover,
. Moreover,
where
![]()
Because (as is easily seen by differentiation) ![]() takes a minimum value of 0 when u=1, we see that
takes a minimum value of 0 when u=1, we see that ![]() for all t. Consequently,
for all t. Consequently,

so that
![]()
We now show that the limit is a stationary point. As
![]()
we see that provided Q is a reasonably smooth function
![]()
Further
![]()
and in particular taking ![]()
![]()
Since ![]() for any fixed
for any fixed ![]() , and in particular for
, and in particular for ![]() , it now follows that
, it now follows that
![]()
so that ![]() is a stationary point, which will usually be the posterior mode.
is a stationary point, which will usually be the posterior mode.
More information about the EM algorithm can be found in Dempster et al. (1977) or Tanner (1996).
9.2.3 Semi-conjugate prior with a normal likelihood
Suppose that we have independent normally distributed observations x1, x2, … , ![]() . We use the notation
. We use the notation
![]()
In Section 2.13, we noted that the conjugate joint prior ![]() for the normal mean and variance is not
a product of a function of θ and
for the normal mean and variance is not
a product of a function of θ and ![]() , so that θ and
, so that θ and ![]() are not independent a priori. Nevertheless, an assumption of prior independence would seem appropriate for many problems, and so we are sometimes led to consider a situation in which
are not independent a priori. Nevertheless, an assumption of prior independence would seem appropriate for many problems, and so we are sometimes led to consider a situation in which
![]()
independently of one another. Such a prior is described as semi-conjugate by Gelman et al. (2004, Section 3.4) and as conditionally conjugate by O’Hagan (2004, Section 6.33). The latter term arises because conditional on knowledge of θ, it is a conjugate prior for ![]() and vice versa.
and vice versa.
With such a prior, we know that, conditional on knowledge of ![]() , the posterior of θ is
, the posterior of θ is
![]()
where
![]()
(cf. Section 2.3) whereas, conditional on knowledge of θ, the posterior of ![]() is
is
![]()
where
![]()
(cf. Section 2.7).
In such a case, we can use the EM algorithm to estimate the posterior mode of θ, effectively augmenting the data with the variance ![]() . We begin by observing that (ignoring terms which do not depend on θ) the log posterior density is
. We begin by observing that (ignoring terms which do not depend on θ) the log posterior density is
![]()
To carry out the E-step we first note that since
![]()
and the expectation of a chi-squared variate is equal to its number of degrees of freedom, we know that
![]()
where ![]() and
and ![]() . For the M-step we must find that value
. For the M-step we must find that value ![]() which maximizes
which maximizes ![]() . But
. But ![]() is of the form of the log of the posterior density we would have got for θ had we had the same prior (
is of the form of the log of the posterior density we would have got for θ had we had the same prior (![]() ) and observations
) and observations ![]() with mean θ and known
variance S1/n1. Now it follows from Section 2.3
on ‘Several normal observations with a normal prior’ that the posterior mean of θ in this case is at
with mean θ and known
variance S1/n1. Now it follows from Section 2.3
on ‘Several normal observations with a normal prior’ that the posterior mean of θ in this case is at
![]()
(the right-hand side depends on ![]() through S1), and so we see that this is the value of θ giving the required maximum.
through S1), and so we see that this is the value of θ giving the required maximum.
To illustrate this case, we return to the data on wheat yield considered in the example towards the end of Section 2.13 in which n=12, ![]() and S=13 045. We will take the prior for the variance considered in that Section, namely,
and S=13 045. We will take the prior for the variance considered in that Section, namely, ![]() with S0=2700 and
with S0=2700 and ![]() . For the mean, we will take a prior which is
. For the mean, we will take a prior which is ![]() where
where ![]() and
and ![]() , which approximates well to the values for the marginal distribution in that Section (according to which
, which approximates well to the values for the marginal distribution in that Section (according to which ![]() ). The resulting marginal densities are nearly the same, but because we now assume prior independence the joint distribution is different.
). The resulting marginal densities are nearly the same, but because we now assume prior independence the joint distribution is different.
It seems that a reasonable starting point for the iteration is ![]() . Then we get
. Then we get ![]() ,
, ![]() , and
, and ![]() thereafter.
thereafter.
9.2.4 The EM algorithm for the hierarchical normal model
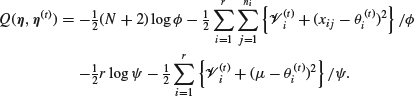
The EM algorithm is well suited to the analysis of hierarchical models and we can see this by examining the important case of the hierarchical normal model. Although the formulae we shall derive do not look pretty, they are very easy to use. Suppose that
![]()
with ![]() , where
, where
![]()
as in Section 8.5 and that we wish to estimate the hyperparameters μ, ![]() and
and ![]() . In this case
. In this case ![]() takes the place of η in the example on genetic linkage, while we augment the data by
takes the place of η in the example on genetic linkage, while we augment the data by ![]() to give augmented data
to give augmented data ![]() . We can use a reference prior for
. We can use a reference prior for ![]() , but (as mentioned in Section 8.5) this will not work for
, but (as mentioned in Section 8.5) this will not work for ![]() . Accordingly, we will adopt the prior
. Accordingly, we will adopt the prior
![]()
It is then easily seen that (up to an additive constant)

To carry out the E-step, observe that conditional on the value of ![]() the parameters
the parameters ![]() where
where
![]()
using the notation introduced in Section 6.5 for averaging over a suffix (cf. Section 2.3). We can now see that
![]()
and similarly
![]()
so that
It is now clear that the M-step gives

9.2.5 A particular case of the hierarchical normal model
Gelman et al. (2004, Table 11.2) quote the following data from Box et al. (1978, Table 6.1) on the coagulation time in seconds for blood drawn from N=24 animals randomly allocated to four different diets:
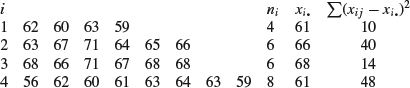
The data has been slightly adjusted, so that the averages come out to be whole numbers. It should perhaps be noted that the prior adopted in this and the preceding subsections differs slightly from that adopted by Gelman et al. The within-groups sum of squares is ![]() and the overall mean is
and the overall mean is
![]() . It, therefore, seems reasonable to start iterations from
. It, therefore, seems reasonable to start iterations from ![]() and
and ![]() . As for
. As for ![]() , we can take
, we can take
![]()
This results in
![]()
Similarly, we get ![]() ,
, ![]() ,
, ![]() ,
, ![]() ,
, ![]() and
and ![]() .
.
We can now feed these values in and commence the iteration, getting ![]() ,
, ![]() and
and ![]() . Continuing the iteration, we get rapid convergence to
. Continuing the iteration, we get rapid convergence to ![]() ,
, ![]() ,
, ![]() ,
, ![]() ,
, ![]() ,
, ![]() and
and ![]() .
.