
Chapter 17
Troubleshooting Tools
The Following CompTIA Network+ Exam Objectives Are Covered in This Chapter:
- 4.3 Given a scenario, use appropriate software tools to troubleshoot connectivity issues.
- Protocol analyzer
- Throughput testers
- Connectivity software
- Ping
- Tracert/traceroute
- Dig
- Ipconfig/ifconfig
- Nslookup
- Arp
- Nbtstat
- Netstat
- Route
Most of us are running Transmission Control Protocol/Internet Protocol (TCP/IP) version 4 on our networks these days, so we absolutely need a way to test IP connectivity. But we also need to be able to test and verify IPv6 networks. The reason for this is that even though Microsoft makes the majority of client platforms, a lot of the commands used to test IP connectivity are really platform independent, and most of them can now use both IPv4 and IPv6. Even so, keep in mind that the Network+ exam focuses on the basic concepts of the function and use of the TCP/IP utilities that come with Windows.
You can use several utilities, both command line and GUI, to verify TCP/IP function on Windows workstations, and most of them are listed in the chapter objectives. But there are a few others that I’m going to discuss with you because they’re really important for anyone working in the networking field to know about. Here’s a list of them:
- Traceroute (tracert in Microsoft)
- ipconfig/winipcfg (ifconfig in UNIX)
- ping
- arp
- nslookup (dig in UNIX)
- Mtr
- route
- nbtstat
- netstat
- ftp
- telnet
And by the way…it’s very important that you don’t just blow through the output that I’ve supplied for each command. Instead, pay serious attention to it because to meet the Network+ objectives, you’ll be required to correctly identify each command’s output.
So, let’s cut right to the chase and take a look at some of these commands and their output. Oh, and do try and have fun with it!
To find up-to-the-minute updates for this chapter, please see www.lammle.com/forum or the book’s web site at www.sybex.com/go/netplus2e.
Protocol analyzers, also called sniffers or network monitors, are used to capture packets in their raw format as they cross the network. Windows desktop operating systems before Windows Vista came with a built-in protocol analyzer called Network Monitor, but that is no longer the case, although you can download one for free that will work with the newer operating systems.
The Network Monitor tool that comes with these operating systems will capture only packets that are sourced from or destined to the computer on which the tool is running. Commercial sniffers like Wireshark or OmniPeek can capture any packets because they set the NIC to operate in promiscuous mode, which means the NIC processes all packets that it sees.
Protocol analyzers can be used to determine the type of traffic that you have in your network, and depending on the product and the bells and whistles contained therein, you may be able to sort the results based on port numbers, protocols, and so on. Another use of a sniffer is to examine the traffic that should be occurring on the network when something is not working to aid in troubleshooting. These devices can capture and display all packets involved in the connection setup including, for example, request and response headers to a web server.
For example, earlier in the book we discussed the operation of DHCP, and you learned that there are a series of four packet types that must occur for a DHCP client to receive an IP configuration from the server. As a review, those packets are as follows:
- DHCPDISCOVER
- DHCPOFFER
- DHCPREQUEST
- DHCPACK
If you turned on the analyzer and then executed the ipconfig/release and ipconfig/renew commands on the client (more on those commands later in this chapter), you should see these four packets in the analyzer’s capture file. The packets would be interspersed with the hundreds and perhaps thousands of other packet types that would be captured, but by using the display filtering options in the software, you can easily segregate out the DHCP traffic. An example of the DHCP process as seen in a capture is shown in Figure 17-1.
Figure 17-1: DHCP capture
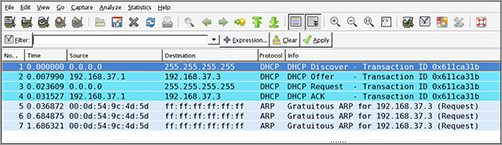
If all you saw in the capture were the DHCDISCOVER packets with no DHCPOFFER packets, you could reasonably assert that the DHCP server is not receiving the DHCPDISCOVER packets (perhaps it is located in another broadcast domain or perhaps it is not on). Additionally, you could examine fields in the DHCPOFFER packets that may tell you that the DHCP server is out of addresses. The point is that the tool can be used to troubleshoot the issue.
Users of a network often complain about the speed of the network. Network “speed” is in some ways a personal perception because some people have more patience than others. To determine when a network slowdown is real as opposed to perceived, you need to actually measure the throughput. That’s what throughput testers are used for.
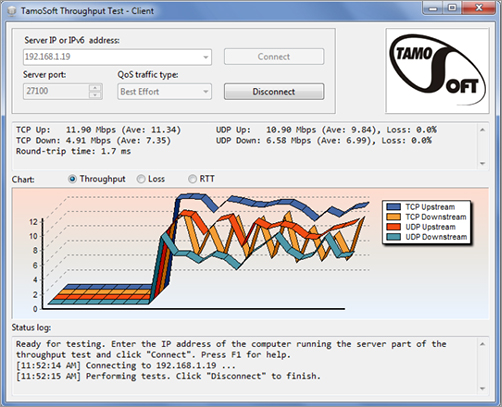
These devices, typically software based, work much like a protocol analyzer in that they measure the traffic seen on the network and can also classify the types of traffic that are eating up your bandwidth (which is probably what you really need to know). Figure 17-2 shows one version of this software by Tamosoft.
This software is installed on a server and also on a client. In the figure the software is measuring traffic between the client and a server. It shows the throughput for traffic in real time and in this shot is breaking that traffic up by unicast (TCP) and broadcast (UDP) types and by direction.
Figure 17-2: Throughput
Earlier in this book, I discussed the importance of baselines, and this is another area where they are important. Network throughput figures mean little without a baseline with which comparisons can be made. How do you know what is abnormal when you don’t know what normal is? Baselines should be taken when the network is operating well, but also they should be taken when the traffic load is normal.
There are times when you need to make a remote connection to a machine to perform troubleshooting but you are miles away. Connectivity software is designed to allow you to make a connection to the machine, see the desktop, and perform any action you could perform if you were sitting in front of it.
Microsoft has made what it calls Remote Desktop software available for free with Windows products since Windows NT. When this software is installed (installed by default in later versions) on both source and destination computers, a remote desktop connection can be made.
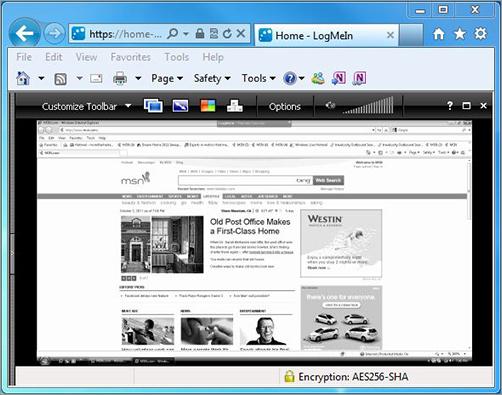
Commercial tools are also available that (of course) claim to have more functionality, and they probably do have a few extra bells and whistles. These include LogMein.com, GoToMyPC, and others. Figure 17-3 shows the session window for a LogMein.com session.
The advantages of these connectivity tools are obvious. With these tools, you can do anything you need to on the machine as long as you can connect. They also allow you to see what a user is actually doing when they encounter a problem rather than having to rely on what they tell you they are doing. You can even show a user what they are doing wrong. Most of these tools allow for chat sessions and for either end of the connection to take control of the machine. You can also transfer files to them if required (maybe a DLL got deleted, for example).
Figure 17-3: Logmein
For starters, let’s pose these questions: Where do all those packets really go when we send them over the Internet? And, how do all the packets actually get to their destinations? Well, we can use the TCP/IP traceroute (tracert with Windows) command-line utility to help us answer both questions because its output will show us every router interface a TCP/IP packet passes through on the way to its destination.
Traceroute (trace for short) displays the path a packet takes to get to a remote device in all its glory by using something we call IP Packet Time-To-Live (TTL), time-outs, and Internet Control Message Protocol (ICMP) error messages. And it’s also a handy tool for troubleshooting an internetwork because we can use it to figure out which router along a path through that internetwork happens to be causing a network failure when a certain destination machine or network is, or suddenly becomes, unreachable.
To use tracert, at a Windows command prompt, type tracert, a space, and the Domain Name Service (DNS) name or IP address of the host machine to which you want to find the route. The tracert utility will respond with a list of all the DNS names and IP addresses of the routers that the packet is passing through on its way. Plus, tracert uses TTL to indicate the time it takes for each attempt.
Following is the tracert output from my workstation in Boulder, Colorado, to my Lammle.com server in Dallas, Texas:
C:Users	lammle>tracert www.lammle.com
Tracing route to lammle.com [206.123.114.186]
over a maximum of 30 hops:
  1     1 ms    <1 ms    <1 ms  dslmodem.domain.actdsltmp [192.168.0.1]
  2    53 ms    52 ms    52 ms  hlrn-dsl-gw36-228.hlrn.qwest.net [207.225.112.228]
  3    52 ms    53 ms    52 ms  hlrn-agw1.inet.qwest.net [71.217.189.25]
  4    75 ms    75 ms    74 ms  dal-core-01.inet.qwest.net [67.14.2.53]
  5    76 ms    76 ms    76 ms  dap-brdr-01.inet.qwest.net [205.171.225.49]
  6    76 ms    76 ms    76 ms  205.171.1.110
  7    75 ms    76 ms   106 ms  xe-0-0-0.er2.dfw2.us.above.net [64.125.26.206]
  8    76 ms    76 ms    76 ms  209.249.122.74.available.above.net [209.249.122.74]
  9    76 ms    76 ms    76 ms  65.99.248.250
 10    76 ms    76 ms    76 ms  pageuppro.pageuppro.com [206.123.114.186]
Trace complete.
Okay, were you able to see that the packet bounces through several routers before arriving at its destination? Good! This utility is useful if you are having problems reaching a web server on the Internet and you want to know if a wide area network (WAN) link is down or if the server just isn’t responding. What this means to you is that, basically, wherever the trace stops is a great place to start troubleshooting. No worries here, though—the previous output shows that every router is up and responding. Last, notice in the output the ms. This is the latency of each hop, meaning the delay. Tracert (or traceroute) is a great troubleshooting tool you can use to find out where your network bottlenecks are.
If you use traceroute or tracert and receive an asterisk, this indicates that the attempt to reach that router took longer than the default time-out value. This is very good to know because it can mean that either the router is extremely busy or that a particular link is slow. Another reason for getting an asterisk could be that the administrator has disabled ICMP on the router that the packet is trying to hop through.
Why would someone want to do that? For security reasons, that’s why. It happens to be a typical strategic move done on the routers that interface to the ISP to conceal their actual location so bad guys can’t hack into them and therefore into your internetwork. It’s a good idea, and I highly recommend doing it.
If you are running traceroute and see repeating addresses and TTL time-outs, you probably have a routing loop.
The utilities known as ipconfig (in Windows) and ifconfig (in UNIX/Linux/Mac) will display the current configuration of TCP/IP on a given workstation—including the current IP address, DNS configuration, Windows Internet Naming Service (WINS) configuration, and default gateway. In the following sections, I will show you how to use both.
Using the ipconfig Utility
With the new Mac, Windows Vista, Windows 7, and Windows Server 2008 operating systems, you can see now the IPv6 configuration because IPv6 is enabled by default. The output of the ipconfig command provides the basic routed protocol information on your machine. From a DOS prompt, type ipconfig, and you’ll see something like this:
C:Users	lammle>ipconfig
Windows IP Configuration
Ethernet adapter Local Area Connection:
   Connection-specific DNS Suffix  . : domain.actdsltmp
   Link-local IPv6 Address . . . . . : fe80::2836:c43e:274b:f08c%11
   IPv4 Address. . . . . . . . . . . : 192.168.0.6
   Subnet Mask . . . . . . . . . . . : 255.255.255.0
   Default Gateway . . . . . . . . . : 192.168.0.1
Wireless LAN adapter Wireless Network Connection:
   Connection-specific DNS Suffix  . : qwest.net
   Link-local IPv6 Address . . . . . : fe80::20e7:7fb8:8a00:832b%10
   IPv4 Address. . . . . . . . . . . : 10.0.1.198
   Subnet Mask . . . . . . . . . . . : 255.255.255.0
   Default Gateway . . . . . . . . . : fe80::21b:63ff:fef3:3694%10
                                       10.0.1.1
Tunnel adapter Local Area Connection* 6:
   Media State . . . . . . . . . . . : Media disconnected
   Connection-specific DNS Suffix  . :
Tunnel adapter Local Area Connection* 7:
   Media State . . . . . . . . . . . : Media disconnected
   Connection-specific DNS Suffix  . :
 [output cut for brevity]
Wow, there sure are a lot of options in this output compared to the output for earlier versions of Windows! First, what’s up with all these interfaces showing? I only have two—one Ethernet and one wireless. You can see that my Ethernet adapter shows up first, and it has an IP address, a mask, and a default gateway plus an IPv6 address and a DNS suffix. The next configured interface is the wireless local area network (LAN) adapter, which has an IP address, a mask, a default gateway, an IPv6 address, and the IPv6 default gateway as well. This IPv6 default gateway address is simply my router advertising that it runs IPv6 and saying, “I am the way out of the local LAN!”
The next adapters are disconnected because they are logical interfaces and I’m not using them—my machine actually shows eight, but I cut the output because it provides no new information. They’re automatically inserted because IPv6 is installed and running on my machine, and these adapters allow me to run IPv6 over an IPv4-only network.
But just in case the ipconfig command doesn’t provide enough information for you, try the ipconfig /all command—talk about details. Here’s the beginning of that output:
C:Users	lammle>ipconfig /all
Windows IP Configuration
   Host Name . . . . . . . . . . . . : globalnet-todd
   Primary Dns Suffix  . . . . . . . : globalnet.local
   Node Type . . . . . . . . . . . . : Hybrid
   IP Routing Enabled. . . . . . . . : No
   WINS Proxy Enabled. . . . . . . . : No
   DNS Suffix Search List. . . . . . : globalnet.local
                                       domain.actdsltmp
                                       qwest.net
Ethernet adapter Local Area Connection:
   Connection-specific DNS Suffix  . : domain.actdsltmp
   Description . . . . . . . . . . . : Intel(R) 82566MM Gigabit Network Connection
   Physical Address. . . . . . . . . : 00-1E-37-D0-E9-35
   DHCP Enabled. . . . . . . . . . . : Yes
   Autoconfiguration Enabled . . . . : Yes
   Link-local IPv6 Address . . . . . : fe80::2836:c43e:274b:f08c%11(Preferred)
   IPv4 Address. . . . . . . . . . . : 192.168.0.6(Preferred)
   Subnet Mask . . . . . . . . . . . : 255.255.255.0
   Lease Obtained. . . . . . . . . . : Monday, October 20, 2008 9:08:36 AM
   Lease Expires . . . . . . . . . . : Tuesday, October 21, 2008 9:08:39 AM
   Default Gateway . . . . . . . . . : 192.168.0.1
   DHCP Server . . . . . . . . . . . : 192.168.0.1
   DNS Servers . . . . . . . . . . . : 192.168.0.1
                                       205.171.3.65
   NetBIOS over Tcpip. . . . . . . . : Enabled
Wireless LAN adapter Wireless Network Connection:
   Connection-specific DNS Suffix  . : qwest.net
   Description . . . . . . . . . . . : Intel(R) Wireless WiFi Link 4965AGN
   Physical Address. . . . . . . . . : 00-1F-3B-3F-4A-D9
   DHCP Enabled. . . . . . . . . . . : Yes
   Autoconfiguration Enabled . . . . : Yes
   Link-local IPv6 Address . . . . . : fe80::20e7:7fb8:8a00:832b%10(Preferred)
   IPv4 Address. . . . . . . . . . . : 10.0.1.198(Preferred)
   Subnet Mask . . . . . . . . . . . : 255.255.255.0
   Lease Obtained. . . . . . . . . . : Monday, October 20, 2008 10:43:53 AM
   Lease Expires . . . . . . . . . . : Monday, October 20, 2008 2:43:53 PM
   Default Gateway . . . . . . . . . : fe80::21b:63ff:fef3:3694%10
                                       10.0.1.1
   DHCP Server . . . . . . . . . . . : 10.0.1.1
   DNS Servers . . . . . . . . . . . : 10.0.1.1
   NetBIOS over Tcpip. . . . . . . . : Enabled
Tunnel adapter Local Area Connection* 6:
   Media State . . . . . . . . . . . : Media disconnected
   Connection-specific DNS Suffix  . :
   Description . . . . . . . . . . . : isatap.globalnet.local
   Physical Address. . . . . . . . . : 00-00-00-00-00-00-00-E0
   DHCP Enabled. . . . . . . . . . . : No
   Autoconfiguration Enabled . . . . : Yes
Tunnel adapter Local Area Connection* 7:
   Media State . . . . . . . . . . . : Media disconnected
   Connection-specific DNS Suffix  . :
   Description . . . . . . . . . . . : isatap.{9572A79F-3A58-4E9B-9BD0-8F6FF2F058FC}
   Physical Address. . . . . . . . . : 00-00-00-00-00-00-00-E0
   DHCP Enabled. . . . . . . . . . . : No
   Autoconfiguration Enabled . . . . : Yes
[output cut]
As you can see, it’s more of the same—a whole lot more. The most important thing I want you to notice is that I’ve received the hardware information about each interface, including the Media Access Control (MAC) address. Also significant is that I can see the Dynamic Host Configuration Protocol (DHCP) lease times and DNS addresses now.
But why stop here? There are two more valuable options you need to use with the ipconfig command. They are /release and /renew.
When you change networks, you need to get the IP address of that subnet and/or virtual LAN (VLAN). Vista and Windows 7 work most of the time without doing anything, but sometimes I do have to renew the IP configuration when changing networks. But that’s easy—just type ipconfig /renew from a command prompt, and if you’re connected to a DHCP server that’s available, you’ll then magically receive an IP address.
Now, if it still doesn’t work, you’ll need to release and renew your TCP/IP settings. To release your current DHCP TCP/IP information, you must elevate your command prompt or you’ll get this warning:
C:Users	lammle>ipconfig /release
The requested operation requires elevation.
C:Users	lammle>
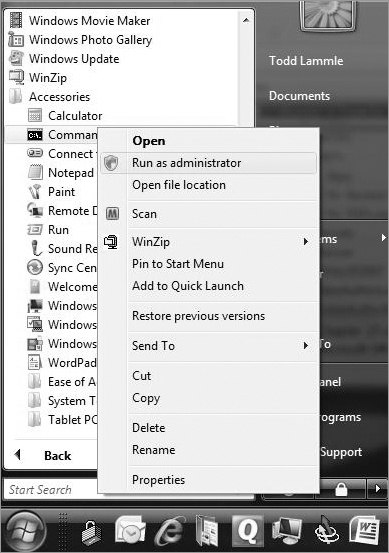
Should this happen to you, choose Start All Programs Accessories Command Prompt, right-click, and choose Run As Administrator. (Of course, you’ll have to enter your name and password to do this if you are using Vista or Windows 7. But we love Vista and Windows 7, right? Okay, maybe not always.) Figure 17-4 shows how I did this.
Once your command prompt has been duly elevated, you can use the ipconfig /release command and then the ipconfig /renew command to get new TCP/IP information for your host.
Figure 17-4: Elevating your command prompt
Using the ifconfig Utility
There is a utility in Linux/UNIX/Mac that will give you information similar to what ipconfig shows. It’s called ifconfig (short for interface configuration). Although ipconfig and ifconfig show similar information, there are major differences between these two utilities. The ipconfig utility is mainly used to view the TCP/IP configuration for a computer. You can use ifconfig to do the same thing, but ifconfig can also be used to configure a protocol or a particular network interface.
The general syntax of the ifconfig command is as follows:
ifconfig interface [address [parameters]]
The interface parameter equals the UNIX name of the interface, such as eth0. If the optional address parameter is specified, the ifconfig command sets the IP address for the interface to the address you’ve specified. When the ifconfig command is used by itself with no parameters, all configured interfaces will be reported on. But if only the interface name is specified, you’ll get output that looks like this:
# ifconfig eth0
eth0  Link encap 10Mbps Ethernet  HWaddr 00:00:C0:90:B3:42
inetaddr 172.16.0.2 Bcast 172.16.0.255 Mask 255.255.255.0 UP BROADCAST RUNNING  MTU 1500  Metric 0
   RX packets 3136 errors 217 dropped 7 overrun 26
   TX packets 1752 errors 25 dropped 0 overrun 0
Looking at this, we can see that the eth0 interface is a 10Mbps Ethernet interface. The interface’s MAC and IP address information is displayed in this output as well. And, although not shown in the output, the ifconfig tool can show you the DNS information configured on the host.
ping is the most basic TCP/IP utility, and it’s included with most TCP/IP stacks for most platforms. Windows, again, is no exception. In most cases, ping is a command-line utility, although there are many GUI implementations available. You use the ping utility for two primary purposes:
- To find out if a host is responding
- To find out if you can reach a host
Here’s the syntax:
Ping hostname or IP address
If you ping any station that has an IP address, the ICMP that’s part of that particular host’s TCP/IP stack will respond to the request. The ICMP test and response looks something like this:
ping 204.153.163.2
Pinging 204.153.163.2 with 32 bytes of data:
Reply from 204.153.163.2: bytes=32 time<10ms TTL=128
Reply from 204.153.163.2: bytes=32 time=1ms TTL=128
Reply from 204.153.163.2: bytes=32 time<10ms TTL=128
Reply from 204.153.163.2: bytes=32 time<10ms TTL=128
Because I’ve received a reply from the destination station (204.153.163.2, in this case), I know that I can reach the host and that it’s responding to basic IP requests. Don’t forget that you can use name resolution and ping to a name, such as ping www.sybex.com, and as long as that name can be resolved, you’re golden.
Most versions of ping work the same way, but there are some switches you can use to specify certain information, like the number of packets to send, how big a packet to send, and so on. And if you’re running the Windows command-line version of ping, just use the /? or –? switch to display a list of the available options like this:
C:Users	lammle>ping /?
Usage: ping [-t] [-a] [-n count] [-l size] [-f] [-i TTL] [-v TOS]
       [-r count] [-s count] [[-j host-list] | [-k host-list]]
       [-w timeout] [-R] [-S srcaddr] [-4] [-6] target_name
The command will also output a table showing what each of the options does, presented here in Table 17-1.
Table 17-1: Options for ping switches
| Option | Description |
| -t | Pings the specified host until stopped. To see statistics and continue, press Ctrl+Break; to stop, press Ctrl+C. |
| -a | Resolves addresses to hostnames. |
| -n count | Specifies the number of echo requests to send. |
| -l size | Sends the buffer size. |
| -f | Sets the Don’t Fragment flag in the packet (IPv4-only). |
| -i TTL | Specifies the time to live of the packet. |
| -v TOS | Specifies the type of service (IPv4-only). |
| -r count | Records the route for count hops (IPv4-only). |
| -s count | Specifies the timestamp for count hops (IPv4-only). |
| -j host-list | Uses a loose source route along the host-list (IPv4-only). |
| -k host-list | Uses a strict source route along host-list (IPv4-only). |
| -w timeout | Specifies the time-out to wait for each reply in milliseconds. |
| -R | Uses the routing header to test the reverse route also (IPv6-only). |
| -S srcaddr | Specifies the source address to use. |
| -4 | Forces using IPv4. |
| -6 | Forces using IPv6. |

You can ping your local TCP/IP interface by typing ping 127.0.0.1 or ping localhost. Understand that both addresses represent the local interface. Really, you can use any address in the 127.0.0.0 network range to provide a loopback test.
As you can see, there’s a plethora of options you can use with the ping command from a Windows DOS prompt. But I really want you to focus on a few from the previous output. (I’m going to go over only a few of them, but you can get on your host machine and play with all the options.)
The -a switch is very cool because if you have name resolution (such as a DNS server), you can see the name of the destination host even if you only know its IP address. The -n switch sets the number of echo requests to send, where four is the default, and the -w switch allows you to adjust the time-out in milliseconds. The default ping time-out is 1 second (1000ms).
The -6 is also nice if you want to ping an IPv6 host. By the way, unless you really love typing 128-bit addresses, this is a wonderful example of how important name resolution is. And then there’s -t, which keeps the ping running. Here’s an example of a ping to an IPv6 address:
C:Users	lammle>ping -6 fe80::1063:16af:3f57:fff9
Pinging fe80::1063:16af:3f57:fff9 from fe80::1063:16af:3f57:fff9%25
with 32 bytes of data:
Reply from fe80::1063:16af:3f57:fff9: time<1ms
Reply from fe80::1063:16af:3f57:fff9: time<1ms
Reply from fe80::1063:16af:3f57:fff9: time<1ms
Reply from fe80::1063:16af:3f57:fff9: time<1ms
Ping statistics for fe80::1063:16af:3f57:fff9:
Packets: Sent = 4, Received = 4, Lost = 0 (0% loss),
Approximate round trip times in milli-seconds:
Minimum = 0ms, Maximum = 0ms, Average = 0ms
C:Users	lammle>
And if I want to have a continuous ping, I just use that -t option like this:
C:Users	lammle>ping -t 192.168.0.1
Pinging 192.168.0.1 with 32 bytes of data:
Reply from 192.168.0.1: bytes=32 time=7ms TTL=255
Reply from 192.168.0.1: bytes=32 time=1ms TTL=255
Reply from 192.168.0.1: bytes=32 time=1ms TTL=255
Reply from 192.168.0.1: bytes=32 time=1ms TTL=255
Reply from 192.168.0.1: bytes=32 time=1ms TTL=255
Reply from 192.168.0.1: bytes=32 time=1ms TTL=255
Ping statistics for 192.168.0.1:
Packets: Sent = 6, Received = 6, Lost = 0 (0% loss),
Approximate round trip times in milli-seconds:
Minimum = 1ms, Maximum = 7ms, Average = 2ms
Control-C
^C
C:Users	lammle>
This ping will just keep going and going like the Energizer Bunny until you press Ctrl+C. And by the way, it’s an awesome tool for troubleshooting links.
Using the Address Resolution Protocol
The Address Resolution Protocol (ARP) is part of the TCP/IP protocol stack. It’s used to translate TCP/IP addresses to MAC addresses using broadcasts. When a machine running TCP/IP wants to know which machine on an Ethernet network is using a certain IP address, it will send an ARP broadcast that says, in effect, “Hey…exactly who is IP address xxx.xxx.xxx.xxx?” The machine that owns the specific address will respond with its own MAC address, supplying the answer. The machine that made the inquiry will respond by adding the newly gained information to its own ARP table.
In addition to the normal usage, the ARP designation refers to a utility in Windows that you can use to manipulate and view the local workstation’s ARP table.
The Windows ARP Table
The ARP table in Windows includes a list of TCP/IP addresses and their associated physical (MAC) addresses. This table is cached in memory so that Windows doesn’t have to perform ARP lookups for frequently accessed TCP/IP addresses like those of servers and default gateways. Each entry contains an IP address and a MAC address plus a value for TTL that determines how long each entry will remain in the ARP table.
Remember that the ARP table contains two kinds of entries:
- Dynamic
- Static
Dynamic ARP table entries are created whenever the Windows TCP/IP stack performs an ARP lookup but the MAC address isn’t found in the ARP table. When the MAC address of the requested IP address is finally found, or resolved, that information is then added into the ARP table as a dynamic entry. Whenever a request to send a packet to the host is sent to the Data Link layer, the ARP cache is checked first before an ARP broadcast is sent out. Remember, the ARP request is broadcast on the local segment—it does not go through a router.
The ARP table is cleared of dynamic entries whose TTL has expired to ensure that the entries are current.
Static ARP table entries serve the same function as dynamic entries but are made manually using the arp utility.
Using the arp Utility
You now know that ARP is a protocol included in the TCP/IP suite. You also understand that ARP is used by IP to determine the MAC address of a device that exists on the same subnet as the requesting device. When a TCP/IP device needs to forward a packet to a device on the local subnet, it first looks in its own table, called an ARP cache, for an association between the known IP address of the destination device on the local subnet and that same device’s MAC address. The cache is called that because the contents are periodically weeded out.
If no association that includes the destination IP address can be found, the device will then send out an ARP broadcast that includes its own MAC and IP information as well as the IP address of the target device and a blank MAC address field. Filling in that blank is the object of the whole operation—it’s the unknown value that the source device is requesting to be returned to it in the form of an ARP reply. Windows includes a utility called arp that allows us to check out the operating system’s ARP cache. To view this, from a Windows DOS prompt, use the arp command like this:
C:Uses	lammle>arp
Displays and modifies the IP-to-Physical address translation tables used
by address resolution protocol (ARP).
ARP -s inet_addr eth_addr [if_addr]
ARP -d inet_addr [if_addr]
ARP -a [inet_addr] [-N if_addr] [-v]
Table 17-2 describes the various options that you can use with the arp command.
Table 17-2: arp options
| Option | Description |
| -a | Displays current ARP entries by interrogating the current protocol data. If inet_addr is specified, the IP and physical addresses for only the specified computer are displayed. If more than one network interface uses ARP, entries for each ARP table are displayed. |
| -a | Displays current ARP entries by interrogating the current protocol data. If inet_addr is specified, the IP and physical addresses for only the specified computer are displayed. If more than one network interface uses ARP, entries for each ARP table are displayed. |
| -g | Same as -a. |
| -v | Displays current ARP entries in verbose mode. All invalid entries and entries on the loopback interface will be shown. |
| inet_addr | Specifies an Internet address. |
| -N | Displays the ARP entries for the network interface specified by if_addr. |
| -d | Deletes the host specified by inet_addr. inet_addr. May be wildcarded with * to delete all hosts. |
| -s | Adds the host, and associates the Internet address inet_addr with the physical address eth_addr. The physical address is given as six hexadecimal bytes separated by hyphens. The entry is permanent. |
| eth_addr | Specifies a physical address. |
| if_addr | If present, specifies the Internet address of the interface whose address translation table should be modified. If not present, the first applicable interface will be used. |
Sheesh. Looking at that output really makes me wish we were all just running IPv6 because, as you already should know, IPv6 doesn’t need ARP as well as many other annoying features and protocols required when running IPv4.
Of note, the Windows arp utility is primarily useful for resolving duplicate IP addresses. For example, let’s say your workstation receives its IP address from a DHCP server but it accidentally receives the same address that some other workstation gets. And so, when you try to ping it, you get no response. Your workstation is basically confused—it’s trying to determine the MAC address, and it can’t because two machines are reporting that they have the same IP address. To solve this little snag, you can use the arp utility to view your local ARP table and see which TCP/IP address is resolved to which MAC address.
To display the entire current ARP table, use the arp command with the –a switch, like so:
C:Users	lammle>arp -a
Interface: 192.168.0.6 --- 0xb
Internet Address      Physical Address      Type
192.168.0.1           00-15-05-06-31-b0     dynamic
192.168.0.255         ff-ff-ff-ff-ff-ff     static
224.0.0.22            01-00-5e-00-00-16     static
224.0.0.252           01-00-5e-00-00-fc     static
239.255.255.250       01-00-5e-7f-ff-fa     static
255.255.255.255       ff-ff-ff-ff-ff-ff     static
Interface: 10.100.10.54 --- 0x10
Internet Address      Physical Address      Type
10.100.10.1           00-15-05-06-31-b0     dynamic
10.100.10.255         ff-ff-ff-ff-ff-ff     static
224.0.0.22            01-00-5e-00-00-16     static
224.0.0.252           01-00-5e-00-00-fc     static
239.255.255.250       01-00-5e-7f-ff-fa     static
By the way, the –g switch will produce the same result.
Now, from this output, you can tell which MAC address is assigned to which IP address. Then, for static assignments, you can tell which workstation has a specific IP address and if it’s indeed supposed to have that address by examining your network documentation—you do have that record, right?
For DHCP-assigned addresses, you can begin to uncover problems stemming from multiple DHCP scopes or servers doling out identical addresses and other common configuration issues. And remember that under normal circumstances, you shouldn’t see IP addresses in the ARP table for a given interface that aren’t members of the same IP subnet as the interface.
If the machine has more than one network card (as may happen in Windows servers and on laptops with both Ethernet and wireless cards), each interface will be listed separately.
It’s good to know that in addition to displaying the ARP table, you can use the arp utility to manipulate the table itself. To add static entries to the ARP table, you use the arp command with the –s switch. These static entries will stay in the ARP table until the machine is rebooted. A static entry essentially hardwires a specific IP address to a specific MAC address so that when a packet needs to be sent to that IP address, it will automatically be sent to that MAC address. Here’s the syntax:
arp –s [IP Address] [MAC Address]
Simply replace the [IP Address] and [MAC Address] sections with the appropriate entries, like so:
arp –s 204.153.163.5 00–a0–c0–ab–c3–11
Now, take a look at your new ARP table by using the arp –a command. You should see something like this:
Internet Address         Physical Address         Type
204.153.163.5            00–a0–c0–ab–c3–11        static
Finally, if you want to delete entries from the ARP table, you can either wait until the dynamic entries time out or use the –d switch with the IP address of the static entry you’d like to delete, like this:
arp –d 204.153.163.5
Doing so effectively deletes the entry from the ARP table in memory.
The arp utility doesn’t confirm successful additions or deletions (use arp -a or arp -g for that), but it will give you an error message if you use incorrect syntax.
Whenever you’re configuring a server or a workstation to connect to the Internet, you’ve got to start by configuring DNS if you want name resolution to happen (that is, if you want to be able to type www.sybex.com instead of an IP address). When configuring DNS, it’s a very good thing to be able to test what IP address DNS is returning to ensure that it’s working properly. The nslookup utility allows you to query a name server and quickly find out which name resolves to which IP address.
The UNIX dig (short for domain information groper) utility does the exact same thing as nslookup. It’s primarily a command-line utility that allows you to perform a single DNS lookup for a specific entity, but it can also be employed in batch mode for a series of lookups. Detailed information on this command is beyond the scope of this study guide, but you can find more information on the Web by searching for “unix dig.”
The nslookup utility comes with Windows NT and later as well as most versions of UNIX and Linux, but not with Windows 95/98. You can run it from a Windows command prompt. At the command prompt, you can start the nslookup utility by typing nslookup and pressing Enter. When you’re inside this utility, the command prompt will change from something similar to C:> sign to a shorter > sign. It will also display the name and IP address of the default DNS server you will be querying (you can change it, if necessary). Then you can start using nslookup. The following output gives you a sample of the display after the nslookup command has been entered at the C:> prompt.
C:Users	lammle>nslookup
Default Server:  gnt-corpdc1.globalnet.local
Address:  10.100.36.12
>
The primary job of nslookup is to tell you the many different features of a particular domain name, the names of the servers that serve it, and how they’re configured. To get that, just type in a domain name at the > prompt, and the nslookup utility will then return this information:
> lammle.com
Server:  dslmodem.domain.actdsltmp
Address:  192.168.0.1
Non-authoritative answer:
Name:    lammle.com
Address:  206.123.114.186
What this tells you is that the server that returned the information is not responsible (authoritative) for the zone information of the domain for which you requested an address and that the name server for the domain lammle.com is located at the IP address 206.123.114.186.
You can also ask nslookup for other information by setting a different option within nslookup. Just type set option at the > prompt and replace option with the actual option you want to use—for example, use >set type=mx to determine the IP address of your email server. If you can’t decide which one you want, use the question mark (?) at the greater than sign (>) to see all available options.
If you type in nslookup and receive the reply
NS request timed out.
    timeout was 2 seconds.
***Can't find server name for address 206.123.114.186: Timed out
Default Server:  UnKnown
Address:  fec0:0:0:ffff::1
then you know your DNS servers are not answering. You need to get over to the DNS server stat!
Resolving Names with the Hosts Table
The Hosts table is really a lot like DNS, except its entries are static for each and every host and server. Within the Hosts table, you’ll find a collection of hostnames that devices reference for name-resolution purposes. And even though it works in both IPv4 and IPv6 environments, it’s unlikely you will use it these days because the Hosts table is a way-ancient relic left over from old UNIX machines.
But just because it’s museum quality doesn’t mean you won’t run into it now and then, which is the main reason I’m showing it to you. You can find the Hosts table in C:WindowsSystem32driversetc. Just double-click the file, and then choose to open the file in Notepad or another text editor. Here’s the default information—it’s really nothing more than an explanation of how to use it and the local hosts for both IP and IPv6:
# Copyright (c) 1993-2006 Microsoft Corp.
#
# This is a sample HOSTS file used by Microsoft TCP/IP for Windows.
#
# This file contains the mappings of IP addresses to host names. Each
# entry should be kept on an individual line. The IP address should
# be placed in the first column followed by the corresponding host name.
# The IP address and the host name should be separated by at least one
# space.
#
# Additionally, comments (such as these) may be inserted on individual
# lines or following the machine name denoted by a '#' symbol.
#
# For example:
#
#      102.54.94.97     rhino.acme.com          # source server
#       38.25.63.10     x.acme.com              # x client host
127.0.0.1       localhost
::1             localhost
Any information entered to the right of a pound sign (#) in a Hosts file is ignored, so you can use this space for comments.
Because it’s a plain ASCII text file, you add the IP address under the local hosts and then the name to which you want to resolve the IP address. It’s a pretty simple configuration, and again, one I don’t recommend using because you have to type in the names of every host on every machine in your network. DNS is definitely the name resolution of choice for networks today.
Do not get the Hosts table confused with the hostname command. The hostname command doesn’t do much but display the name of your host, as shown:
C:Users	lammle>hostname /?
Prints the name of the current host.
hostname
C:Users	lammle>hostname
globalnet-todd
Mtr, or My traceroute, is a computer program that combines the functions of the traceroute and ping utilities in a single network diagnostic tool. It also adds round-trip time and packet loss to the output—very cool.
Mtr probes routers on the route path by limiting the number of hops individual packets are allowed to traverse and listening to news of their termination. It will regularly repeat this process (usually once per second) and keep track of the response times of the hops along the path.
Mtr is great if you have Linux or UNIX, but by default, it’s not installed on Windows devices. Third-party applications of Mtr are available to install on Windows, but Microsoft did respond with its own version of Mtr—it’s called pathping and provides the same functions as Mtr. Here’s a look at the output and the options:
C:Users	lammle>pathping
Usage: pathping [-g host-list] [-h maximum_hops] [-i address] [-n]
                [-p period] [-q num_queries] [-w timeout]
                [-4] [-6] target_name
Table 17-3 lists the options of the Windows pathping command.
Table 17-3: pathping options
| Option | Description |
| -g host-list | Uses a loose source route along the host-list. |
| -h maximum_hops | Specifies the maximum number of hops to search for the target. |
| -i address | Uses the specified source address. |
| -n | Does not resolve addresses to hostnames. |
| -p period | Waits period milliseconds between pings. |
| -q num_queries | Specifies the number of queries per hop. |
| -w timeout | Waits timeout milliseconds for each reply. |
| -4 | Forces using IPv4. |
| -6 | Forces using IPv6. |
The Mtr utility is basically the same as traceroute and ping, but it does give you some additional output that can help you troubleshoot your network.
I went over static routing in Chapter 9, “Introduction to IP Routing,” so you know that Windows devices like routers perform routing. Most of the time, it’s a good idea to leave Windows alone, but it’s still good to know how to add and delete routes on your Windows machines.
Probably the biggest reason for manipulating the routing table on a Windows server is to create a firewall. For instance, let’s say we’re running an Application layer firewall on a Windows server located between the demilitarized zone (DMZ) and the internal network. This scenario would mean the routing that’s happening on the server or hosts located in the DMZ wouldn’t be able to reach the internal network’s hosts and vice versa.
To circumvent this problem, we would need to employ both static and default routing because Windows Vista, Windows 7, and Server 2008 don’t support routing protocols—running routing protocols on hosts and servers wouldn’t be a good solution for today’s networks, and Microsoft knows that.
To view the routing table on a Windows device, use the route print command, as shown in Figure 17-5.
In this output, you can see that each of the routes was added automatically when the system booted up. (This is all based on the configuration of your IP stack.) To see all the options available with the route command, type the route command and then press Enter. To add a route to your routing table, use the following syntax:
route [-f] [-p] [Command [Destination] [mask Netmask] [Gateway] [metric Metric]] [if Interface]]
Figure 17-5: route print output

Using the route Command Options
Let’s start with the switches you can use:
-f Using this command with any of the options like add, change, or delete will clear the routing table of all entries that aren’t host routes (routes with the subnet mask 255.255.255.255), the loopback network route(s) (routes with a destination of 127.0.0.0 and the subnet mask 255.0.0.0), and any multicast routes (those with a destination of 224.0.0.0 and the subnet mask 240.0.0.0).
-p If you use this with the add command, the individual route will be added to the Registry and then used to initialize the IP routing table whenever TCP/IP is started. Important to remember is that by default, the routes you’ve statically added won’t remain in the routing table the next time TCP/IP boots. And if you use -p with the print command, you’ll get shown a list of the persistent routes that are stored in the Registry location of HKEY_LOCAL_MACHINESYSTEMCurrentControlSetServicesTcpipParametersPersistentRoutes.
Now, let’s take a look at how and when you would use the route command. Table 17-4 shows the command options available and what they do when you are using the route command with them.
Table 17-4: route command options
| Command | Purpose |
| add | Adds a route |
| change | Modifies an existing route |
| delete | Deletes a route(s) |
| Prints a route(s) |
Here’s a description of some other tasks you can accomplish via the rest of the command’s options:
destination This will give you the network destination of a given route. If the host bits of the network address are set to 0, it will be depicted with the destination’s IP network address, an IP address for a specific host route, or the default route of 0.0.0.0.
mask netmask This will provide you with the netmask—often referred to as the subnet mask—that’s associated with the destination network. The default destination subnet mask is 0.0.0.0, and typically you’ll see 255.255.255.255 representing a host route. It’s really important to remember that the destination address can’t be more specific than its corresponding subnet mask. What I’m saying is that there absolutely can’t be a bit set to 1 in the destination address if the equivalent bit in the subnet mask is a 0.
gateway The gateway also depends on the network address and subnet mask, but it’s even more specific and delimits what’s called the next-hop IP address. For routes located on a local subnet, the gateway address maps directly to a particular interface. If the destination is on a remote network, the gateway IP address will direct packets to the neighboring router.
metric metric Metric refers to the cost of a given route from the sending to the receiving device, and it’s a value between 1 and 9999. Devices use this value to choose the best, or most efficient, routes among those in its routing table—the route with the lowest value wins. This decision can also include factors like the number of hops, the speed, reliability, and available bandwidth of the path being considered plus the various administrative aspects associated with it.
if interface This tool depends on information from the gateway address and determines the interface index for the specific interface that needs to receive the data. You can get a list of interfaces along with their relevant interface indexes by typing the route print command.
/? Using this will allow you to view help at the command prompt.
Some Examples of the route Command
Even though the finer points of the route command demand that you use caution when deploying some of the options, I’ll still list the basics of the route command because it can be really useful. I highly recommend that you spend some time practicing them on a non-production server, though—especially at first.
- To display the entire IP routing table, type route print.
- To add a default route with the default gateway address 192.168.10.1, type route add 0.0.0.0 mask 0.0.0.0 192.168.10.1.
- To add a route to the destination 10.1.1.0 with the subnet mask 255.255.255.0 and the next-hop address 10.2.2.2, type route add 10.1.1..0 mask 255.255.255.0 10.2.2.2.
- If you want to, let’s say, add a persistent route to the destination 10.100.0.0 with the subnet mask 255.255.0.0 and the next-hop address 10.2.0.1, type route -p add 10.100.0.0 mask 255.255.0.0 10.2.0.1. If you want to delete the route to the destination 10.100.0.0 with the subnet mask 255.255.0.0, enter route delete 10.100.0.0 mask 255.255.0.0.
- And finally, if you want to change the next-hop address of a route with the destination 10.100.0.0 and the subnet mask 255.255.0.0 from 10.2.0.1 to 10.7.0.5, type route change 10.100.0.0 mask 255.255.0.0 10.7.0.5.
Okay, let’s move on to some other important Windows utilities.
Microsoft Windows uses an interface called Network Basic Input/Output System (NetBIOS), which relates names with workstations and is an upper-layer interface that requires a transport protocol—usually, TCP/IP. But IPv6 can be used as well. Deploying the nbtstat utility will achieve these three important things:
- Track NetBIOS over TCP/IP statistics
- Show the details of incoming and outgoing NetBIOS over TCP/IP connections
- Resolve NetBIOS names
Understand that because NetBIOS name resolution is primarily a Windows network utility, the nbtstat command is available only in Windows-based operating systems.
To display a basic description of nbtstat and its associated options, type nbtstat at the command line. Then, use these options to get a display of information about NetBIOS over TCP/IP hosts. Here are some of the tools, or switches, you can use:
| –a | –A | |
| –c | –n | |
| –r | –R | |
| –S | –s | |
| –a | –A | |
| –c | –n | |
| –r | –R | |
| –S | –s |
All nbtstat switches are case sensitive. Generally speaking, lowercase switches deal with NetBIOS names of hosts, and the uppercase ones deal with the TCP/IP addresses of hosts.
The –a Switch
Making use of the–a switch will get you a remote machine’s NetBIOS name table consisting of a list of every NetBIOS name the machine from which you’ve deployed the switch knows of. The –a switch produced the output from server S1 shown in Figure 17-6.
Figure 17-6: Sample output of the nbtstat –a command
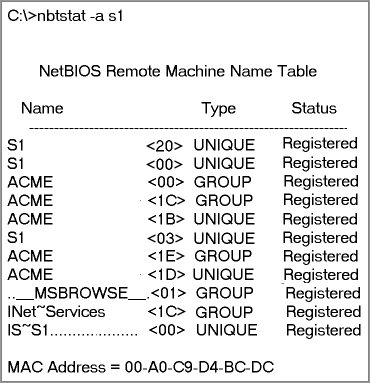
So, using this switch arranges the NetBIOS name-table information in table form with output in four columns. The Name column displays the NetBIOS name entry for the remote host machine.
The next column gives you a unique two-digit hexadecimal identifier for the NetBIOS name. This identifier represents the last byte of the NetBIOS name depicted in the Name column, and it’s important because the same name could actually be used several times for the same machine. Plus, it identifies the specific service on the particular host that the name is referencing. Table 17-5 and Table 17-6 list the hexadecimal identifiers for unique and group hostnames.
Table 17-5: Last-byte identifiers for unique names
| Hex ID | Description |
| 00 | General name for the computer. |
| 03 | Messenger service ID used to send messages between a WINS server and a workstation. This is the ID registered with a WINS server. |
| 06 | Remote Access Server (RAS) server service ID. |
| 20 | File-serving service ID. |
| 21 | RAS client. |
| 53 | DNS. |
| 123 | Network Time Protocol (NTP). |
| 1B | Domain master browser ID. A NetBIOS name with this ID indicates the domain master browser. |
| 1F | Network Dynamic Data Exchange (NetDDE) service ID. |
| BE | Network monitor agent ID. |
| BF | Network monitor utility ID. |
Table 17-6: Last-byte identifiers for group names
| Hex ID | Description |
| 01 | Master browser for a domain to other master browsers. |
| 20 | Internet group name ID. This ID is registered with the WINS server to indicate which computers are used for administrative purposes. |
| 1C | Domain group name ID. |
| 1D | Master browser name. |
| 1E | Normal group name. |
The Type column refers to (surprise) the type of NetBIOS name being referenced. Unique NetBIOS names refer to individual hosts, and group names refer to logical groupings of workstations—either domains or workgroups.
The Status column gives you information about the status of a host’s NetBIOS even if it hasn’t been registered with the rest of the network.
The –A Switch
The –A switch works just like the –a switch and will give you the same output, but the syntax of the command is different. Obviously, you use an uppercase A instead of a lowercase one, and you also have to include the host’s IP address instead of its NetBIOS name. To use it, type nbtstat followed by –A and finally the IP address of the specific host whose NetBIOS table you want to check out:
nbtstat –A 199.153.163.2
The –c Switch
Use the –c switch to display the local NetBIOS name cache on the workstation it’s running on. Figure 17-7 shows sample output of the nbtstat –c command.
Figure 17-7: Sample output of the nbtstat –c command
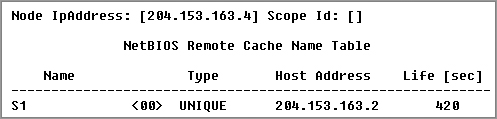
Each entry in this display shows the NetBIOS name, the hex ID for the service that was accessed, the type of NetBIOS name (unique or group), the IP address that the name resolves to, and its life. The Life value shows how many seconds each entry will live in the cache. When this time expires, the entry will be deleted.
Sometimes, deploying nbtstat to display the cache will get you the response “No names in the cache” because all entries in the cache have expired. This is what happens if you don’t regularly access machines or services with NetBIOS names.
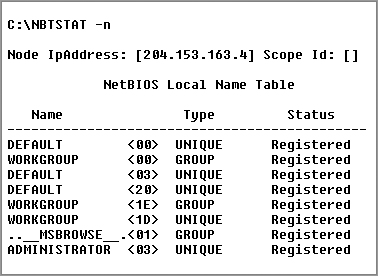
The –n Switch
The –n switch will give you the local NetBIOS name table on a Windows device. Figure 17-8 shows output that’s similar to the output of the –a switch except for one important thing: What you’re seeing is the NetBIOS name table for the machine you’re running the command on instead of that of another host. Check it out.
Figure 17-8: Sample output of the nbtstat –n command
The –r Switch
This switch is probably the one you’ll use most often when you want to get ahold of NetBIOS over TCP/IP (NBT) statistics because it tells you exactly how many NetBIOS names have been resolved to TCP/IP addresses. Figure 17-9 shows sample output of the nbtstat –r command.
Figure 17-9: Sample output of the nbtstat –r command
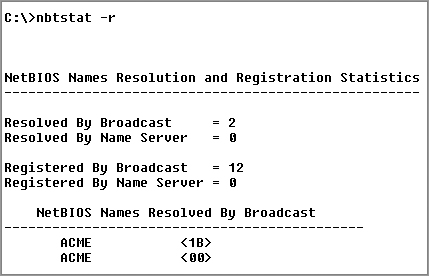
What you can see here is that the statistics are divided into two categories. First, there are the NetBIOS names resolution and registration statistics. This is how many names have been resolved or registered either by broadcasts on the local segment or via lookup from a WINS name server.
Next you have the NetBIOS unique and group names and their associated hex IDs that were resolved or registered. In Figure 17-9, you can see that there’s a distinct lack of information regarding names resolved by a name server. What this means is that the output is telling you that there’s no WINS server operating—instead, all NetBIOS names were resolved by broadcast only.
The –r switch comes in handy when you want to determine how a workstation is resolving NetBIOS names and whether WINS is configured correctly. If WINS isn’t configured correctly or it’s simply not being used, the numbers in the Resolved By Name Server and Registered By Name Server categories will always be zero.
The –R Switch
Unlike the –a and –A switches, -r and -R use the same letter but do not have anything in common.
Here’s an example. Let’s say you have a bad name in the NetBIOS name cache but the right name is in the LMHOSTS file instead. (The LMHOSTS file contains NetBIOS names of stations and their associated IP addresses.) Because the cache is consulted before the LMHOSTS file is, that bad address will remain in the cache until it expires.
This command is used when you want to purge the NetBIOS name table cache and reload the LMHOSTS file into memory. You do that using the nbtstat command with the –R switch, like so:
nbtstat –R
You can practice this nbtstat -R command on your host to purge the NBT remote cache table.
The –S Switch
Using the -S switch will display the NetBIOS sessions table that lists all NetBIOS sessions to and from the host from which you issued the command. The –S switch displays both workstation and server sessions but lists remote addresses by IP address only.
Figure 17-10 shows sample output of the nbtstat –S command.
Here you can see the NetBIOS name being displayed along with its hex ID and the status of each session. An entry in the In/Out column determines whether the connection has been initiated from the computer on which you’re running nbtstat (outbound) or whether another computer has initiated the connection (inbound). The numbers in the Input and Output columns indicate in bytes the amount of data transferred between the stations.
Figure 17-10: Sample output of the nbtstat –S command

The –s Switch
As with the –A and –a switches, the lowercase –s switch is similar to its uppercase sibling. The nbtstat –s command produces the same output as nbtstat –S except that it will also attempt to resolve remote-host IP addresses into hostnames. Figure 17-11 shows sample output from the nbtstat –s command.
Figure 17-11: Sample output of the nbtstat –s command

Note the similarities between Figure 17-10 and Figure 17-11.
As with the netstat command, with the nbtstat command you can place a number for an interval at the end to direct it to deploy once every so many seconds until you press Ctrl+C.
Using netstat is a great way to check out the inbound and outbound TCP/IP connections on your machine. You can also use it to view packet statistics like how many packets have been sent and received, the number of errors, and so on.
When used without any options, netstat produces output similar to the following, which shows all the outbound TCP/IP connections. This utility is a great tool to use to determine the status of outbound web connections. Take a look:
C:Users	lammle>netstat
Active Connections
  Proto  Local Address          Foreign Address        State
  TCP    10.100.10.54:49545     gnt-exchange:epmap     TIME_WAIT
  TCP    10.100.10.54:49548     gnt-exchange:epmap     TIME_WAIT
  TCP    10.100.10.54:49551     gnt-exchange:1151      ESTABLISHED
  TCP    10.100.10.54:49557     gnt-exchange:1026      ESTABLISHED
  TCP    10.100.10.54:49590     gnt-exchange:epmap     TIME_WAIT
  TCP    127.0.0.1:49174        globalnet-todd:62514   ESTABLISHED
  TCP    127.0.0.1:62514        globalnet-todd:49174   ESTABLISHED
  TCP    192.168.0.6:2492       blugro2relay:2492      ESTABLISHED
  TCP    192.168.0.6:2492       blugro3relay:2492      ESTABLISHED
  TCP    192.168.0.6:49170      64.12.25.26:5190       ESTABLISHED
  TCP    192.168.0.6:49171      oam-d05c:5190          ESTABLISHED
  TCP    192.168.0.6:49473      205.128.92.124:http    CLOSE_WAIT
  TCP    192.168.0.6:49625      64-190-251-21:ftp      ESTABLISHED
  TCP    192.168.0.6:49628      210-11:http            ESTABLISHED
  TCP    192.168.0.6:49629      varp1:http             ESTABLISHED
  TCP    192.168.0.6:49630      varp1:http             ESTABLISHED
  TCP    192.168.0.6:49631      varp1:http             ESTABLISHED
  TCP    192.168.0.6:49632      varp1:http             ESTABLISHED
  TCP    192.168.0.6:49635      199.93.62.125:http     ESTABLISHED
  TCP    192.168.0.6:49636      m1:http                ESTABLISHED
  TCP    192.168.0.6:49638      spe:http               ESTABLISHED
The Proto column lists the protocol being used. You can see that I’m connected to my Exchange server and an FTP server and that I have some HTTP sessions open; by the way, all of them use TCP at the Transport layer.
The Local Address column lists the source address and the source port (source socket). The Foreign Address column lists the address of the destination machine (the hostname if it’s been resolved) plus the fact that the destination port is a TCP port. If the destination port is known, it will show up as the well-known port. In the previous output, you see http instead of port 80 and ftp instead of port 21.
The State column indicates the status of each connection. This column shows statistics only for TCP connections because User Datagram Protocol (UDP) establishes no virtual circuit to the remote device. Usually, this column indicates ESTABLISHED when a TCP connection between your computer and the destination computer has been established. All sessions eventually time out and then close, and you can see that I have all of these listed in my netstat output.
If the address of either your computer or the destination computer can be found in the HOSTS file on your computer, the destination computer’s name, rather than the IP address, will show up in either the Local Address or Foreign Address column.
The output of the netstat utility depends on the switch. By using the netstat /? command, we can see the options available to us.
C:Users lammle>netstat /?
All of the netstat switch options are listed in Table 17-7.
Table 17-7: netstat options
| Option | Description |
| -a | Displays all connections and listening ports. |
| -b | Displays the executable involved in creating each connection or listening port. In some cases, well-known executables host multiple independent components, and in these cases the sequence of components involved in creating the connection or listening port is displayed. In this case, the executable name is in [ ] at the bottom; on top is the component it called, and so forth, until TCP/IP was reached. Note that this option can be time consuming and will fail unless you have sufficient permissions. |
| -e | Displays Ethernet statistics. This may be combined with the -s option. |
| -f | Displays fully qualified domain names (FQDNs) for foreign addresses. |
| -n | Displays addresses and port numbers in numerical form. |
| -o | Displays the owning process ID associated with each connection. |
| -p proto | Shows connections for the protocol specified by proto; proto may be TCP, UDP, TCPv6, or UDPv6. If used with the -s option to display per-protocol statistics, proto may be IP, IPv6, ICMP, ICMPv6, TCP, TCPv6, UDP, or UDPv6. |
| -r | Displays the routing table. |
| -s | Displays per-protocol statistics. By default, statistics are shown for IP, IPv6, ICMP, ICMPv6, TCP, TCPv6, UDP, and UDPv6; the -p option may be used to specify a subset of the default. |
| -t | Displays the current connection offload state. Redisplays selected statistics, pausing interval seconds between each display. Press Ctrl+C to stop redisplaying statistics. If -t is omitted, netstat will print the current configuration information once. |
Simply type netstat followed by a space and then the particular switch you want to use. Some switches have options, but no matter what, the syntax is basically the same.
Note that with UNIX-type switches, the hyphen absolutely must be included. This is common in Microsoft operating systems for TCP/IP utilities that originate from UNIX systems. I’m not going to exhaustively go over each and every switch, but make sure you practice all of these on your own Windows machine.
The –a Switch
When you use the –a switch, the netstat utility displays all TCP/IP connections and all UDP connections. Figure 17-12 shows sample output produced by the netstat –a command.
Figure 17-12: Sample output of the netstat –a command

The last two entries in Figure 17-12 show that the protocol is UDP and give the source-port nicknames nbname and nbdatagram. These are the well-known port numbers of 137 and 138, respectively. These port numbers are commonly seen on networks that broadcast the NetBIOS name of a workstation on the TCP/IP network. You can tell that this is a broadcast because the destination address is listed as *:* (meaning “any address, any port”).
The State column in Figure 17-12 has no entry because UDP is not a connection-oriented protocol and, therefore, has no connection state.
The most common use for the –a switch is to check the status of a TCP/IP connection that appears to be hung. You can determine if the connection is simply busy or is actually hung and no longer responding.
The –e Switch
The -e switch displays a summary of all the packets that have been sent over the Network Interface Card (NIC) as of that instant. The Received and Sent columns show packets coming in as well as being sent:
C:Users	lammle>netstat -e
Interface Statistics
                           Received            Sent
Bytes                       7426841         7226953
Unicast packets               25784           35006
Non-unicast packets            1115           12548
Discards                          0               0
Errors                            0              71
Unknown protocols                 0
You can use the –e switch to display the following categories of statistics:
Bytes The number of bytes transmitted or received since the computer was turned on. This statistic is useful for finding out if data is actually being transmitted and received or if the network interface isn’t doing anything at all.
Unicast packets The number of packets sent from or received at this computer. To register in one of these columns, the packet must be addressed directly from one computer to another and the computer’s address must be in either the source or destination address section of the packet.
Non-unicast packets The number of packets that weren’t directly sent from one workstation to another. For example, a broadcast packet is a non-unicast packet. The number of non-unicast packets should be smaller than the number of unicast packets. If the number of non-unicast packets is as high or higher than that of unicast packets, too many broadcast packets are being sent over your network. Definitely find the source of these packets and make any necessary adjustments to optimize performance.
Discards The number of packets that were discarded by the NIC during either transmission or reception because they weren’t assembled correctly.
Errors The number of errors that occurred during transmission or reception. (These numbers may indicate problems with the network card.)
Unknown protocols The number of received packets that the Windows networking stack couldn’t interpret. This statistic only shows up in the Received column because if the computer sent them, they wouldn’t be unknown, right?
Unfortunately, statistics don’t mean much unless they can be colored with time information. For example, if the Errors column shows 71 errors, is that a problem? It might be if the computer has been on for only a few minutes. But 71 errors could be par for the course if the computer has been operating for several days. Unfortunately, the netstat utility doesn’t have a way of indicating how much time has elapsed for these statistics.
The –r Switch
You use the –r switch to display the current route table for a workstation so that you can see exactly how TCP/IP information is being routed. This will give you the same output as the route print command that we covered earlier in this chapter.
The –s Switch
Using the –s switch displays a variety of TCP, UDP, IP, and ICMP protocol statistics. But be warned—the output you’ll get is really long, which may or may not be okay for you. For this book, it’s way too long for me to insert. With that in mind, we can add another modifier called the -p switch.
The –p Switch
Like the –n switch, the –p switch is a modifier that’s usually used with the –s switch to specify which protocol statistics to list in the output (IP, TCP, UDP, or ICMP). For example, if you want to view only ICMP statistics, you use the –p switch like so:
netstat –s –p ICMP
The netstat utility then displays the ICMP statistics instead of the entire gamut of TCP/IP statistics that the –s switch will typically flood you with. For a different example, let’s use the -s and -p switches to retrieve some IPv6 information:
C:Users	lammle>netstat -s -p IPV6
IPv6 Statistics
  Packets Received                   = 1400
  Received Header Errors             = 0
  Received Address Errors            = 6
  Datagrams Forwarded                = 0
  Unknown Protocols Received         = 0
  Received Packets Discarded         = 451
  Received Packets Delivered         = 10441
  Output Requests                    = 24349
  Routing Discards                   = 0
  Discarded Output Packets           = 3575
  Output Packet No Route             = 41
  Reassembly Required                = 0
  Reassembly Successful              = 0
  Reassembly Failures                = 0
  Datagrams Successfully Fragmented  = 0
  Datagrams Failing Fragmentation    = 0
  Fragments Created                  = 0
C:Users	lammle>
Nice! Gets right to the point. Now, let’s see the TCP connections my host has:
C:Users	lammle>netstat -s -p tcp
TCP Statistics for IPv4
  Active Opens                        = 7832
  Passive Opens                       = 833
  Failed Connection Attempts          = 1807
  Reset Connections                   = 2428
  Current Connections                 = 11
  Segments Received                   = 1391678
  Segments Sent                       = 1340994
  Segments Retransmitted              = 6246
Active Connections
  Proto  Local Address          Foreign Address        State
  TCP    10.100.10.54:54737     gnt-exchange:1151      ESTABLISHED
  TCP    10.100.10.54:54955     gnt-exchange:1026      ESTABLISHED
  TCP    10.100.10.54:55218     gnt-exchange:epmap     TIME_WAIT
  TCP    127.0.0.1:2492         globalnet-todd:54840   ESTABLISHED
  TCP    127.0.0.1:54516        globalnet-todd:62514   ESTABLISHED
  TCP    127.0.0.1:54840        globalnet-todd:2492    ESTABLISHED
  TCP    127.0.0.1:62514        globalnet-todd:54516   ESTABLISHED
  TCP    192.168.0.6:2492       blugro2relay:2492      ESTABLISHED
  TCP    192.168.0.6:2492       blugro3relay:2492      ESTABLISHED
  TCP    192.168.0.6:54527      64.12.25.26:5190       ESTABLISHED
  TCP    192.168.0.6:54531      oam-d05c:5190          ESTABLISHED
  TCP    192.168.0.6:55163      207.123.44.123:http    CLOSE_WAIT
C:Users	lammle>
This kind of efficiency is exactly why it’s good you to use the -p modifier with the -s switch.
Because the Network+ exam doesn’t cover them, we won’t go into detail about what all these statistics mean for most of these commands. You can probably figure out most of them—for instance, Packets Received. For more details, go to Microsoft’s support website at www.support.microsoft.com.
The –n Switch
The -n switch is a modifier for the other switches. When used with them, it reverses the natural tendency of netstat to use names instead of network addresses. In other words, when you use the –n switch, the output always displays network addresses instead of their associated network names. Following is output from the netstat command used with the netstat -n command. It’s showing the same information but with IP addresses instead of names:
C:Users	lammle>netstat
Active Connections
  Proto  Local Address          Foreign Address        State
  TCP    10.100.10.54:54737     gnt-exchange:1151      ESTABLISHED
  TCP    10.100.10.54:54955     gnt-exchange:1026      ESTABLISHED
  TCP    127.0.0.1:2492         globalnet-todd:54840   ESTABLISHED
  TCP    127.0.0.1:54516        globalnet-todd:62514   ESTABLISHED
  TCP    127.0.0.1:54840        globalnet-todd:2492    ESTABLISHED
  TCP    127.0.0.1:62514        globalnet-todd:54516   ESTABLISHED
  TCP    192.168.0.6:2492       blugro2relay:2492      ESTABLISHED
  TCP    192.168.0.6:2492       blugro3relay:2492      ESTABLISHED
  TCP    192.168.0.6:54527      64.12.25.26:5190       ESTABLISHED
  TCP    192.168.0.6:54531      oam-d05c:5190          ESTABLISHED
  TCP    192.168.0.6:55163      207.123.44.123:http    CLOSE_WAIT
C:Users	lammle>netstat -n
Active Connections
  Proto  Local Address          Foreign Address        State
  TCP    10.100.10.54:54737     10.100.36.13:1151      ESTABLISHED
  TCP    10.100.10.54:54955     10.100.36.13:1026      ESTABLISHED
  TCP    127.0.0.1:2492         127.0.0.1:54840        ESTABLISHED
  TCP    127.0.0.1:54516        127.0.0.1:62514        ESTABLISHED
  TCP    127.0.0.1:54840        127.0.0.1:2492         ESTABLISHED
  TCP    127.0.0.1:62514        127.0.0.1:54516        ESTABLISHED
  TCP    192.168.0.6:2492       65.55.239.100:2492     ESTABLISHED
  TCP    192.168.0.6:2492       65.55.248.110:2492     ESTABLISHED
  TCP    192.168.0.6:54527      64.12.25.26:5190       ESTABLISHED
  TCP    192.168.0.6:54531      205.188.248.163:5190   ESTABLISHED
  TCP    192.168.0.6:55163      207.123.44.123:80      CLOSE_WAIT
C:Users	lammle>
Uses for netstat
You might be saying to yourself, “Okay. Fine…I can use lots of cool switches with netstat, but really, what for?” I’m always finding uses for netstat. For instance, once I found a particularly nasty worm on my PC using netstat. I just happened to run netstat for giggles one day and noticed a very large number of outbound connections to various places on the Internet. My PC was sending out SYN packets to a large number of hosts (an indication that my computer was involved—unknowingly—in a large-scale denial of service attack). Upon further examination, I noticed that this activity would start shortly after bootup.
I tried running netstat after bootup and noticed that the first outbound connection was to TCP port 6667, some Internet Relay Chat (IRC) server I’d never heard of—I didn’t even have an IRC client on my machine at the time. The worm was particularly nasty to try to get rid of while active, so I turned off port 6667 on my firewall. That prevented the initial connection to the IRC server and, as I found out later, nicely prevented the worm from getting its instructions from the IRC server. I was then able to simply remove it. I would’ve never found out that this worm was working without netstat. Even my antivirus program missed it.
Using the File Transfer Protocol
Okay, you already know that File Transfer Protocol (FTP) is a subset of TCP/IP and that FTP is used for the transfer of files. In recent years, FTP has become a truly cross-platform protocol for transferring files. Because Internet (and thus TCP/IP) use has skyrocketed, almost every client and server platform has implemented FTP. Windows is no exception. Its TCP/IP stack comes with a command-line ftp utility.
To start the ftp utility, enter ftp at a command prompt. The result is an ftp command prompt:
C:Users	lammle>ftp
ftp>
From this prompt, you can open a connection to an FTP server and upload and download files as well as change the way FTP operates. To display a list of all the commands you can use at the ftp command prompt, type help or ? and press Enter. To get help on a specific command, type help, a space, and then the name of the command. Here is some output from the help command:
ftp>help
Commands may be abbreviated.  Commands are:
!               delete          literal         prompt          send
?               debug           ls              put             status
append          dir             mdelete         pwd             trace
ascii           disconnect      mdir            quit            type
bell            get             mget            quote           user
binary          glob            mkdir           recv            verbose
bye             hash            mls             remotehelp
cd              help            mput            rename
close           lcd             open            rmdir
ftp>
In the following sections, I’ll give you an introduction to uploading and downloading files because every network technician and administrator positively needs to know how to do this. As they come up, I’ll go over the specific commands necessary to perform those two operations as well as any commands that relate to those processes. But first, let’s look at how to begin the process.
Third-party applications are available that provide a GUI interface for FTP, which is easier to use than a command line.
Starting FTP and Logging In to an FTP Server
Of the two FTP file operations (download and upload), the ability to download files is definitely the more crucial for you to have down as a network technician or sys admin. The reason it’s so important for you to master is that network and client operating system drivers and patches are located on FTP servers all over the Internet.
The first steps in starting an FTP download session are to determine the address of the FTP site and start the ftp utility. The FTP site typically has the same name as the website except that the first three characters are ftp instead of www. For example, Microsoft’s website is www.microsoft.com. Its FTP site, on the other hand, is ftp.microsoft.com. We’ll use my personal FTP site as an example for the rest of this section because it works, so I can actually log in to it.
First, start the ftp utility as demonstrated earlier, and then follow these steps:
1. At the ftp command prompt, type open, a space, and the name of the FTP server, like this:
C:Users	lammle>ftp
ftp>open ftp.lammle.com
Connected to ftp.lammle.com.
220---------- Welcome to Pure-FTPd [TLS] ----------
220-You are user number 1 of 50 allowed.
220-Local time is now 11:45. Server port: 21.
220-IPv6 connections are also welcome on this server.
220 You will be disconnected after 15 minutes of inactivity.
User (ftp.lammle.com:(none)):enter
230 Anonymous user logged in
ftp>
As shown here, if the FTP server is available and running, you’ll receive a response welcoming you to the server and asking you for a username. Right now, I just have Anonymous as the username (enabled by default on the FTP server), which means that anyone can log in to it. (By the way, don’t bother trying this on my server because I disabled it for obvious reasons as soon as I finished writing this section.)
You can also start an FTP session by typing ftp, a space, and the address of the FTP server (for example, ftp ftp.globalnettraining.com). This allows you to start the ftp utility and open a connection in one step. Here’s an example:
C:Users	lammle>ftp ftp.globalnettraining.com
Connected to ftp.globalnettraining.com.
220 Microsoft FTP Service
User (ftp.globalnettraining.com:(none)):todd
331 Password required for todd.
Password:not shown when typed
230 User todd logged in.
ftp>quit
2. Enter a valid username, and press Enter.
3. Enter your password, and press Enter. (The password won’t show up when you type it.)
Most Internet web servers that allow just about anyone to download files also allow the username anonymous, as I demonstrated. In addition to anonymous, you can use the username ftp to gain access to a public FTP server. They are both anonymous usernames. Remember that FTP (and UNIX) usernames are case sensitive.
All good, but if you want to access a private FTP server, as I’ll demonstrate in a minute, you’ll need to use the username and password given to you by the site’s administrator. Oh, and sometimes you can use your email address as a password when accessing a public FTP server with a username like anonymous.
You don’t have to enter your entire email address to log in with the anonymous username. Most of the time, FTP server software doesn’t actually verify the actual email address, only that it is, in fact, an email address. To do this, it checks for an @ sign and two words separated by a period. You just need to enter a very short email address to bypass the password (like [email protected]). This is especially helpful if you have a long email address, and it’s a really good idea if you don’t want to get a ton of junk email.
If you enter the wrong username and/or password, the server will tell you so by displaying the following and leaving you at the ftp command prompt:
530 Login Incorrect
Login failed.
This means you’ve got to try again and must start the login process over. If you’re successful, the FTP server will welcome you and drop you back at the ftp command prompt. You’re now ready to start uploading or downloading files.
Downloading Files
After you log in to the FTP server, you’ll navigate to the directory that contains the files you want. Thankfully, the FTP command-line interface is similar to the DOS command-line interface. This is no surprise because DOS is based on UNIX, and FTP is a UNIX utility. Table 17-8 lists and describes the common navigation commands for FTP. (Remember that these are also case sensitive.)
After you navigate to the directory and find the file you want to download, it’s time to set the parameters for the type of file. Files come in two types:
- ASCII, which contains text
- Binary, which is all other files
If you set ftp to the wrong type, the file you download will contain gibberish. So if you’re in doubt, set ftp to download files as binary files. Check out Table 17-8.
Table 17-8: Common FTP navigation commands
| Command | Description |
| Ls | Short for list. Displays a directory listing. Very similar to the DIR command in MS-DOS. |
| Cd | Short for change directory. Works almost identically to the MS-DOS CD command. Use it to change to a different directory and navigate the server’s directory structure. |
| Pwd | Short for print working directory. Displays the current directory on the server. Useful if you forget where you are when changing to several locations on the server. |
| Lcd | Short for local change directory. Displays and changes the current directory on the local machine. Useful when you are downloading a file and aren’t in the directory where you want to put the file. |
To set the file type to ASCII, type ascii at the ftp command prompt. ftp will respond by telling you that the file type has been set to A (ASCII):
ftp>ascii
Type set to A
To set the file type to binary, type binary at the ftp command prompt. ftp will respond by telling you that the file type has been set to I (binary):
ftp>binary
Type set to I
To download the file, just use the get command like this:
ftp>get lammlepress.exe
200 PORT command successful.
150 Opening BINARY mode data connection for 'scrsav.exe'
(567018 bytes).
The file will start downloading to your hard drive. Unfortunately, with its default settings, the ftp utility doesn’t give you any indication of the progress of the transfer. When the file has downloaded, the ftp utility will display the following message and return you to the ftp command prompt:
226 Transfer complete.
567018 bytes received in 116.27 seconds (4.88 Kbytes/sec)
You can download multiple files by using the mget command. Simply type mget, a space, and then something known as a wildcard that specifies the files you want to get. For example, to download all the text files in a directory, type mget *.txt.
Uploading Files
To upload a file to an FTP server, you’ve got to have rights on that specific server. These rights are assigned on a directory-by-directory basis. To upload a file, log in and then follow these steps:
1. At the ftp command prompt, type lcd to navigate to the directory on the local machine where the file resides.
2. Type cd to navigate to the destination directory.
3. Set the file type to ASCII or binary.
4. Use the put command to upload the file.
The syntax of the put command looks like this:
ftp>put local file destination file
Let’s say you want to upload a file called 1.txt on the local server but you want it to be called my.txt on the destination server. To accomplish that, use the following command:
ftp>put 1.txt my.txt
You’ll get the following response:
200 PORT command successful.
150 Opening BINARY mode data connection for collwin.zip
226 Transfer complete.
743622 bytes sent in 0.55 seconds (1352.04 Kbytes/sec)
You can upload multiple files using the mput command. Simply type mput, a space, and then a wildcard that specifies the files. For example, to upload all the text files in a directory, type mput *.txt.
When you’re finished with the ftp utility, just type quit to return to the command prompt.
Part of the TCP/IP protocol suite, telnet is a virtual terminal protocol utility that allows you to make connections to remote devices, gather information, and run programs. Telnet was originally developed to open terminal sessions from remote UNIX workstations to UNIX servers. Although it’s still used for that purpose, we now use it as a troubleshooting tool as well. Figure 17-13 shows the basic Telnet interface as it’s being used to start a terminal session on a remote UNIX host.
Figure 17-13: The Telnet utility
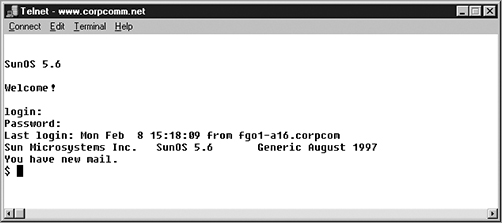
In today’s Windows environments, Telnet is a basic command-line tool for testing TCP connections. You can telnet to any TCP port to see if it’s responding—something that’s especially useful when checking Simple Mail Transfer Protocol (SMTP) and HTTP (web) ports.
As you learned back in Chapter 6, “Introduction to the Internet Protocol,” each upper-layer service in a TCP stack has a number for its address. And by default, each network service that uses a particular address will respond to a TCP request on that specific port.
How to Enable Telnet in Vista
Because most people have Vista or Windows 7 operating systems running on their PCs these days, it’s good to know that, by default, these operating systems install without Telnet available. But there’s a way around that one—if you really must have a Telnet client enabled in these operating systems, here’s how to do it:
1. Open Control Panel.
2. Select Programs And Features.
3. In the left column, select Turn Windows Features On Or Off (get ready for the annoying User Account Control [UAC] prompt, and then enter your name and password).
4. Select the Telnet check box (and any other obscure services you may want enabled), and wait while Vista or Windows 7 thinks for a while and then reboots.
Nice—now you can go to Start and then type telnet in the Start search box to get a Telnet window to open for you. You can also open a DOS prompt and just type telnet from there. Here are the options that Windows provides with Telnet:
Microsoft Telnet> ?
Commands may be abbreviated. Supported commands are:
c    - close                    close current connection
d    - display                  display operating parameters
o    - open hostname [port]     connect to hostname (default port 23).
q    - quit                     exit telnet
set  - set                      set options (type 'set ?' for a list)
sen  - send                     send strings to server
st   - status                   print status information
u    - unset                    unset options (type 'unset ?' for a list)
?/h  - help                     print help information
Now that we’ve finished talking about Telnet, my personal recommendation is that you never use it again. What? Yes, you read that right, and here’s why…
Don’t Use Telnet, Use Secure Shell
What? I just told you how to use Telnet, and now I am telling you not to use it. That’s right, don’t use Telnet! Telnet is totally insecure because it sends all data in crystal-clear text—including your name and password. And I’m pretty sure you know that’s a really bad thing these days. If Microsoft doesn’t even enable it on its latest OSs, than you know it really must be insecure.
So if you shouldn’t use Telnet, what should you use instead? Secure Shell (SSH) is your answer. It provides the same options as Telnet, plus a lot more; but most important, it doesn’t send any data in clear text. The thing is, your servers, routers, and other devices need to be enabled with SSH, and it’s not configured by default on most devices.
Some configuration is usually necessary if you want things to work as they really should, and yes, sometimes it’s a little painful to get everything running smoothly, but it’s all worth it in the long run. Personally, I disable Telnet on all my routers and use SSH exclusively. No lie—I never use Telnet any more if I can help it. Even so, you should still understand Telnet and get in some practice with it in case you do ever need it.
In my Sybex book Cisco CCNA Study Guide, I get into the skinny on how to configure SSH on all Cisco devices and use an SSH client, but because SSH is not among the Network+ objectives, I’m not going to do that here. Still, keep this all in mind when building your networks.
In this chapter, you learned about many of the utilities for using and troubleshooting TCP/IP. These utilities include GUI tools like protocol analyzers, throughput testers, and connectivity software like Remote Desktop, and they include command-line utilities like tracert, ping, arp, netstat, nbtstat, ipconfig, ifconfig, and nslookup.
You also learned how these utilities are used, including their various options and switches and how they all affect the use of the utilities. Finally, you learned about how these utilities work within the TCP/IP suite.
Describe some of the GUI tools available to assist in testing and troubleshooting. These include protocol analyzers, throughput testers, and connectivity software. Understand each product’s purpose and how to use it.
Know how to describe and use the troubleshooting information and statistics that arp, nbtstat, and netstat provide for you. The arp utility shows whether an IP address is being resolved to your MAC address (or someone else’s, in case of conflicts). The netstat utility produces TCP/IP statistics, and nbtstat produces NetBIOS over TCP/IP statistics.
Know how to diagnose a network by using TCP/IP’s troubleshooting commands. The ping command echoes back if a machine is alive and active on a network. The tracert command shows the path that the ping packets take from source to target. And telnet enables a user to participate in a remote text-based session.
Know what the tracert utility does. The tracert utility finds the route from your computer to any computer on a network.
Know what the ping utility does. ping determines whether a particular IP host is responding.
Know what the ftp utility does. The ftp utility allows you to reliably download and upload files from and to an FTP server across the Internet.
Know what the ipconfig and ifconfig utilities do. The ipconfig utility displays TCP/IP configuration information for Windows NT and later operating systems. The ifconfig utility performs a similar function in UNIX environments, in addition to performing certain interface-configuration tasks.
Know what the nslookup and dig utilities do. The nslookup and dig utilities allow you to look up DNS resolution information.
Write the answers to the following questions about command-line tools:
1. What command can you type from a command prompt to see the hops a packet takes to get to a destination host?
2. What tool would you use to verify a complaint about a slow network?
3. You need your IP address, subnet mask, default gateway, and DNS information. What command will you type from a Windows command prompt?
4. You need to log in as a dumb terminal to a server or UNIX host and run programs. What application will you use?
5. You need to add a route to your Windows server’s routing table. What command will you use?
6. You want to log in to a server and transfer files. What application will you use?
7. You need to check your name-resolution information on your host. What command will you type from the command prompt?
8. You want to use netstat, but you want to see only the IP address, not the names of the hosts. Which modifier will you use?
9. You want the IP configuration on a UNIX host. What command will you type at the command prompt?
10. Which Windows command will show you the routing table of your host or server?
You can find the answers in Appendix B.
You will find the answers in Appendix A.
1. Which TCP/IP utility is most often used to test whether an IP host is up and functional?
A. ftp
B. telnet
C. ping
D. netstat
2. Which TCP/IP utility will produce the following result?
Interface: 199.102.30.152
Internet Address   Physical Address   Type
199.102.30.152     A0–ee–00–5b–0e–ac   dynamic
A. arp
B. netstat
C. tracert
D. nbtstat
3. Which Windows utility can you use to connect to a machine 50 miles away to troubleshoot?
A. Remote desktop
B. netstat
C. arp
D. Wireshark
4. Which TCP/IP utility might produce the following output?
Pinging 204.153.163.2 with 32 bytes of data:
Reply from 204.153.163.2: bytes=32 time=1ms TTL=128
Reply from 204.153.163.2: bytes=32 time=1ms TTL=128
Reply from 204.153.163.2: bytes=32 time=1ms TTL=128
Reply from 204.153.163.2: bytes=32 time<10ms TTL=128
A. tracert
B. ping
C. WINS
D. ipconfig
5. Which utility can you use to find the MAC and TCP/IP addresses of your Windows workstation?
A. ping
B. ipconfig
C. ipconfig /all
D. tracert
E. telnet
6. Which ping commands will verify that your local TCP/IP interface is working? (Choose all that apply.)
A. ping 204.153.163.2
B. ping 127.0.0.1
C. ping localif
D. ping localhost
E. ping iphost
7. Which switch for the Windows nbtstat utility will display all NetBIOS name-resolution statistics?
A. –r
B. /r
C. –R
D. /R
8. You need to find a NIC’s specific MAC address and IP address. Which command-line tool can you use to find this information without physically going to the computer?
A. ping
B. nbtstat
C. arp
D. netstat
E. ftp
9. Which nbtstat utility switch will purge and reload the remote NetBIOS name table cache?
A. –r
B. –R
C. /r
D. /R
10. Wireshark is an example of a ________________?
A. Throughput tester
B. Protocol analyzer
C. Remote connection tool
D. Port scanner
11. Which utility produces output similar to the following?
1  110 ms  96 ms  107 ms fgo1.corpcomm.net [209.74.93.10]
2  96 ms  126 ms  95 ms someone.corpcomm.net [209.74.93.1]
3  113 ms  119 ms  112 ms Serial5–1–1.GW2.MSP1.alter.net     [157.130.100.185]
4  133 ms  123 ms  126 ms 152.ATM3–0.XR2.CHI6.ALTER.NET      [146.188.209.126]
5  176 ms  133 ms  129 ms 290.ATM2–0.TR2.CHI4.ALTER.NET   [146.188.209.10]
6  196 ms  184 ms  218 ms 106.ATM7–0.TR2.SCL1.ALTER.NET   [146.188.136.162]
7  182 ms  187 ms  187 ms 298.ATM7–0.XR2.SJC1.ALTER.NET   [146.188.146.61]
8  204 ms  176 ms  186 ms 192.ATM3–0–0.SAN–JOSE9– GW.ALTER.NET [146.188.144.133]
9  202 ms  198 ms  212 ms atm3–0–622M.cr1.sjc.globalcenter.net [206.57.16.17]
10 209 ms  202 ms  195 ms pos3–1–155M.br4.SJC.globalcenter.net [206.132.150.98]
11 190 ms   *   191 ms pos0–0–0–155M.hr3.SNV.globalcenter.net [206.251.5.93]
12 195 ms  188 ms  188 ms pos4–1–0–   155M.hr2.SNV.globalcenter.net [206.132.150.206]
13 198 ms  202 ms  197 ms www10.yahoo.com [204.71.200.75]
A. arp
B. tracert
C. nbtstat
D. netstat
12. You are the network administrator. A user calls you, complaining that the performance of the intranet web server is sluggish. When you try to ping the server, it takes several seconds for the server to respond. You suspect that the problem is related to a router that is seriously overloaded. Which workstation utility could you use to find out which router is causing this problem?
A. netstat
B. nbtstat
C. tracert
D. ping
E. arp
13. Which ipconfig switch will display the most complete listing of IP configuration information for a station?
A. /all
B. /renew
C. /release
D. /?
14. Which utility will display a list of all the routers that a packet passes through on the way to an IP destination?
A. netstat
B. nbtstat
C. tracert
D. ping
E. arp
15. Which Windows TCP/IP utility could you use to find out whether a server is responding on TCP port 21?
A. tcp
B. port
C. ping
D. nbtstat
E. telnet
16. Which arp command can you use to display the currently cached ARP entries?
A. arp
B. arp –all
C. arp /a
D. ipconfig /arp
E. arp /ipconfig
17. Which command-line tool would best be used to verify DNS functionality?
A. netstat
B. nbtstat
C. dig
D. icmp
E. arp
18. Which of the following arp utility switches perform the same function? (Choose all that apply.)
A. –g
B. –A
C. –d
D. –a
19. Which command would you use at a workstation prompt to see the DNS servers that are configured to use? (Choose three.)
A. arp
B. nslookup
C. netstat
D. nbtstat
E. ipconfig/all
F. ifconfig
20. Which nbtstat switch displays a list of all the NetBIOS sessions currently active on the local workstation?
A. –a
B. –r
C. –s
D. –I