CHAPTER 2
BUILDING THE BUSINESS CASE
Measuring the Impact on the Business
If you don’t know where you are going, any road will get you there.
—Lewis Carroll
INTRODUCTION
Once your team is in place and the scope of your disaster recovery planning is determined, the next step is to determine exactly what vital functions need to be included in the plan. Can you easily identify the most vital functions? What happens to the business if one or more functions are suddenly unavailable due to a system failure or other disaster? What is the cost if a function is unavailable? Intuitively, some functions must be more valuable than others, but what is that value? How can this value be measured? In a time of scarce resources, which functions need to be heavily protected and which if any can be safely ignored? In a major disaster affecting many functions, which functions are essential for the company’s survival?
All of these questions are pertinent. Often, decisions are based on the perceived value of a particular function when comparing two functions and the resources for only one of them is available. Capital spending, major improvement projects, and, of course, support staff training often are decided by the perceived value that a function provides the company. But what is this value based on? Where are the data that support this value? How old are the data? Has the value provided by a function changed over time?
The problem with the business-as-usual approach is that it is based on a limited understanding or personal whim—not on the facts. A long-time manager might be acting on “rules-of-thumb” or assumptions that were valid at one time, but may not be any longer. A new manager lacks the “institutional knowledge” about which previous failures have caused the greatest damage. Another caveat is that the business impact of a function changes over time. Companies compete in an ever-shifting business environment. Yesterday’s cash cow may be today’s cash drain. Yesterday’s cash drain may be today’s regulatory compliance requirement and must be working smoothly to keep the government at arm’s length!
Unfortunately, few executives fully appreciate which of their functions are truly critical. They draw on personal experience, but that is limited to the areas with which they are familiar. They can ask their peers, but each person sees the world through the narrow view of his or her own situation. The accounting department will identify all of its functions as critical since it handles the money. The materials management team will identify its functions as critical since the company’s assets are reflected in a fragile collection of materials. The engineering department will think it is the most critical since its technology holds the company’s valuable intellectual property. To some extent, all of these are right!
To determine where the true benefits lie, conduct a detailed Business Impact Analysis that breaks the business down by its major functions, and assigns value to each function in terms of cash flow and regulatory obligations. Then the systems that support these functions are identified and the functions rolled up. Based on this data—based on these facts—an executive can more efficiently assign resources for the greater benefit of the organization.
BUSINESS IMPACT ANALYSIS
A Business Impact Analysis (BIA) is an exploratory review of the important functions that are essential for the operation of the business. This review is used to quantify the value of each function to the business and to identify any risks to the most valuable functions. It also suggests mitigation actions to reduce the likelihood or impact of these risks. In the event of a disaster, the BIA indicates how much is lost per hour or per day for the length of the outage. Many of these functions are linked to an IT system that supports them (lose the IT system, and that function can no longer continue).
A BIA is a snapshot of vital business functions at a given point in time. Any major changes in the operation of the business will require an update to the BIA.
An organization’s critical functions depend on its primary mission. For a call center, a BIA would focus on the key telecommunication services required to service the callers. For a manufacturing firm, this might be the functions required to make the end product. A bank might identify the various financial services offered to its customers. An online store would value availability of its Web page, speed of processing, and security of customer data. And of course each department within the organization will have its own list of critical functions.
A BIA provides many benefits to an organization, many of which are valuable beyond the scope of a business continuity project. These include:
![]() Quantifying the tangible and qualifying the intangible costs of the loss of a critical function.
Quantifying the tangible and qualifying the intangible costs of the loss of a critical function.
![]() Identifying the most critical functions to protect.
Identifying the most critical functions to protect.
![]() Pinpointing the critical resources necessary for each function to operate, such as people, equipment, software, etc.
Pinpointing the critical resources necessary for each function to operate, such as people, equipment, software, etc.
![]() Determining the recovery time objective (RTO) of critical functions. The RTO is the length of time that the organization can operate with a function disabled before the effect of the loss of the function affects other functions.
Determining the recovery time objective (RTO) of critical functions. The RTO is the length of time that the organization can operate with a function disabled before the effect of the loss of the function affects other functions.
![]() Identifying vital records and the impact of their loss.
Identifying vital records and the impact of their loss.
![]() Prioritizing the use of scarce resources if multiple functions are affected at the same time.
Prioritizing the use of scarce resources if multiple functions are affected at the same time.
There are numerous ways that the loss of a function can have a negative financial impact on the organization. The tangible financial costs of a disaster can include:
![]() Direct loss of revenue because products cannot be shipped or services not delivered.
Direct loss of revenue because products cannot be shipped or services not delivered.
![]() Increased waste from the spoilage of materials or finished goods.
Increased waste from the spoilage of materials or finished goods.
![]() Penalties levied by customers for late shipments or lost services.
Penalties levied by customers for late shipments or lost services.
![]() Legal penalties for not conforming to government regulations or reporting requirements.
Legal penalties for not conforming to government regulations or reporting requirements.
Intangible costs due to the loss of a vital business function can be harder to quantify, but are no less damaging. Intangible losses can include:
![]() Loss of customer goodwill.
Loss of customer goodwill.
![]() Reduced confidence in the marketplace that your organization is a reliable supplier.
Reduced confidence in the marketplace that your organization is a reliable supplier.
![]() Employee turnover caused by concern for the viability of the organization.
Employee turnover caused by concern for the viability of the organization.
![]() Damaged image in the community if your disaster harms the local community.
Damaged image in the community if your disaster harms the local community.
![]() Loss of confidence in the organization’s executive management by key stakeholders.
Loss of confidence in the organization’s executive management by key stakeholders.
A well-executed BIA can provide much valuable information to executive management about the organization’s vulnerabilities. This includes:
![]() The maximum acceptable outage (MAO) that the organization can suffer before the organization will have difficulty meeting its objectives.
The maximum acceptable outage (MAO) that the organization can suffer before the organization will have difficulty meeting its objectives.
![]() The recovery time objective (RTO)—the amount of time that a function can be unavailable before the organization is negatively impacted—for each vital function. The cost of the recovery or mitigation solution selected will typically rise as the RTO decreases. This is a major driver of your disaster recovery plan.
The recovery time objective (RTO)—the amount of time that a function can be unavailable before the organization is negatively impacted—for each vital function. The cost of the recovery or mitigation solution selected will typically rise as the RTO decreases. This is a major driver of your disaster recovery plan.
![]() The recovery point objective (RPO) for each function that relies on data. The RPO is the amount of data that can be lost without causing serious damage to a function. The cost of the recovery or mitigation solution selected will typically rise as the RPO decreases.
The recovery point objective (RPO) for each function that relies on data. The RPO is the amount of data that can be lost without causing serious damage to a function. The cost of the recovery or mitigation solution selected will typically rise as the RPO decreases.
Managing a BIA Project
To be successful, a BIA must be run as its own project within your overall disaster recovery project. The project must be supported financially and politically from the highest levels of the organization. Every part of the organization will be touched by a BIA; it is therefore important to appoint a senior executive as the sponsor of the project. Many department heads may be reluctant to share sensitive information about their department due to legitimate concerns about the use of the information or because they are concerned that the information could be used for political purposes. The sponsor’s role is to:
![]() Work with the Business Continuity Manager to select the project manager (who could be the Business Continuity Manager).
Work with the Business Continuity Manager to select the project manager (who could be the Business Continuity Manager).
![]() Approve the project budget.
Approve the project budget.
![]() Communicate to every department the importance of its participation in the BIA.
Communicate to every department the importance of its participation in the BIA.
![]() Address any objections or questions raised about the BIA.
Address any objections or questions raised about the BIA.
![]() Approve the BIA report for submission to the executive team.
Approve the BIA report for submission to the executive team.
A well-run BIA will build credibility for the overall disaster recovery planning project; a poorly run BIA will make a disaster of your disaster recovery project. The key to a successful BIA (as with any other project) is the selection of the right project manager. For a BIA it is especially important, as the BIA will expose every part of the organization to the light of day. The BIA project manager must be able to moderate discussions among department heads about the true value of internal functions. In many cases, there has been no formal examination of the functions performed within each department, which may cause heated discussions about the value of each department. In choosing a project manager, the executive sponsor has two options:
1. Internal—An employee of the organization is appointed as the project manager. The advantages of this approach are that this person already understands the corporate structure, is familiar with the personalities involved, knows where to find people, etc. This approach also builds internal expertise. A possible disadvantage is that the project manager could be caught in the middle of any political battles over the BIA, which could negatively impact the manager’s career at the organization.
2. External—A person from outside the organization is brought in to lead the project. The possible advantages are that this person does not have any internal ties and loyalty is to the executive paying the bill. A potential problem is that the organization’s business functions, finances, and problems will be exposed to this third party.
The BIA project manager is responsible for developing a formal project plan, which is critical for the success of the project. In a large organization, many people have to be interviewed, many meetings need to be held, interim reports must be prepared, and deliverables have to be created. A formal project plan is vital for managing this process. The project plan will be used to manage the activities of the BIA team, which typically consists of several business analysts.
BIA Data Collection
Once the BIA team is created, the next step is to begin the data collection process. The goal of the BIA is to identify the most vital functions in the organization; just what is vital will vary depending on whom you ask. An effective data collection process will help quantify the value of each function in terms of its financial and legal impacts. The level of success of the BIA is directly related to the quality of the information collected. You cannot have a high-quality disaster recovery plan without a foundation of accurate data about your vital business functions.
Your data collection plan must address what data to collect and from whom it is to be collected. It may also be important to consider when to collect the data. As this process takes people away from the important business of their departments, it is critical that the data be collected only once. Time spent in careful development of the questionnaire will save time later by only having to collect the data one time. A data collection plan consists of the following steps:
1. Identify who will receive the questionnaire using an up-to-date organization chart.
2. Develop the questionnaire to be used to collect the data from each department. Many organizations will begin with a standard form which is then modified for use.
3. Provide training to small groups (usually a department at a time) on how to respond to the questionnaire.
4. Follow up with each department to ensure timely completion of the questionnaire.
5. Review responses with respondents if the responses are not clear or are incomplete.
6. Conduct review meetings with each department to discuss responses.
7. Compile and summarize the BIA data for review by the various levels of the organization.
IDENTIFY RESPONDENTS
The first step in identifying who should receive the BIA questionnaire is to obtain a current organizational chart. The organizational chart should identify the different departments or business units within the organization and who their leaders are. These leaders are made responsible for the completion of the questionnaire(s) for their areas. Your executive sponsor must provide you with support in ensuring their cooperation.
Each department first needs to identify the vital functions performed in its area. A form such as Form 2-1, Department Function Identification Form (see the CD-ROM), can be used to develop this list. A separate function is typically identified if it has different resource requirements (e.g., IT systems or machines), staffing roles, or service providers who perform other functions in the department. Each department can have many business functions to report. Therefore, each department numbers its forms according to how many functions it is reporting. This reduces the chance of missing a questionnaire.
Consider including suppliers where their activities are critical to your business.
DEVELOP THE QUESTIONNAIRE
At this time, you should select a single department or business unit as a test case for your questionnaire. This might be a department under the sponsor’s direct control or one where the department head has voiced support for the project. This test department can provide valuable feedback on the questionnaire, including its instructions, the clarity of the questions, or if something is missing. Often what is clear to the BIA team is obscure or has a different meaning to someone who is not familiar with the subject.
Next, develop the questionnaire. Because the end result of the data collection process is the creation of an aggregated report, it is important that everyone responding to the questionnaire use important terms consistently. To ensure consistency, create a glossary of terms as part of the questionnaire. A glossary not only improves reporting consistency, but also speeds up responses and makes it obvious when something new or unexpected is encountered. The use of consistent terminology can also be enforced by using an electronic form for the questionnaire (such as an Excel spreadsheet) with checklists or dropdown lists that confine the answers to a predefined set of answers or range of numbers. If you choose this approach, have an “Other” option available for unexpected situations. Otherwise, the respondent may stop filling out the questionnaire if such a question is encountered. By allowing the choice of “Other,” you can go back later for clarification rather than have the respondent hold the questionnaire until informed about how to respond to a particular question.
A question can be answered in two ways: qualitatively and quantitatively. Qualitative data represent attributes for which you cannot assign a numerical value, such as color or gender. Quantitative data are represented by a numerical value, such as length of time or dollars. Quantitative data can be aggregated, averaged, etc., which makes it easier to analyze a series of responses. As much as possible, make the answers to the BIA questions quantitative; some questions are naturally quantitative, but others may need to be framed in such a way as to require a quantitative response.
The BIA questionnaire begins with an identification block that indicates the department and function to which the questionnaire applies (see Form 2-2, Business Impact Analysis Questionnaire, as an example). The business function name must be the one that it is most commonly known by within the organization. When the final report is reviewed, executives will question high values for functions that no one can recognize, so be sure to use the function’s common name. The name in the function manager field will be used by the BIA team as the contact person if there are any questions. The form should also include the name of the person who completed the form and the date the form was completed.
The next series of questions on the example questionnaire are designed to get a sense of the time sensitive nature of the function: Does the function have to be performed at a certain time? Can it operate at a reduced level for some period of time? How long can it be unavailable before other functions are affected? It is also important to know if this function depends on things outside the control of this department, including a dependency on any particular technology. If yes, this helps the IT department in developing its specific plans and for financial justification to purchase redundant equipment to reduce the likelihood or duration of an outage. To ensure consistency among the answers, the IT department provides a list of all applications on all platforms (desktop, server, mainframe, online). The list is included in the instructions accompanying the form. Be sure to include both the official name and the commonly used name (if one is better known). Respondents can select from this list to minimize variation of system names. This section also documents whether the function depends on outside suppliers.
The next section in the example questionnaire is a matrix that is used to quantify important categories of impact (across the top) with a time scale (along the vertical axis). It is the heart of the analysis and must be tuned to the local requirements. Categories used in the example questionnaire are:
1. Cumulative Financial Loss (revenue lost plus costs incurred)—measured in dollars. This might include:
a. lost revenues.
b. lost sales.
c. financial penalties.
d. wages paid for no work.
e. overtime wages paid to catch up.
f. spoiled materials and finished goods.
2. Legal Compliance Impact—Yes or No. For this and the following items, space is provided later for an explanation.
3. Impact on Customer Confidence—Answers can be Low, Medium, or High.
4. Loss of Supplier Confidence—Answers can be Low, Medium, or High.
5. Damaged Public Image—Answers can be Low, Medium, or High.
Rate each of the impact categories according to its impact over time. For example, what is the Cumulative Financial Loss for one hour of outage? Some examples include:
Example #1
If the function is a busy online catalog, then a one-hour outage might have a significant financial impact because buyers may look elsewhere for goods. Loss of customer confidence and a damaged public image would also come into play.
Example #2
If the function is the shipping department for a factory, then a one-hour outage would mean that shipments would leave the dock late that day. A four-hour outage might involve shipments arriving late to the customer. Beyond four hours, late shipments would be widespread and, depending on the purchasing stipulations, may be refused by the customer. There may even be penalties for late deliveries. Also, at some point, the rest of the factory is shut down since finished goods are piled up with nowhere to go.
Example #3
If the payroll department was down for an hour, then the clerks can tidy up around the office or even leave early for lunch, and the cost is minimal. However, if the same payroll department was inoperable for a week, the company may not have lost revenue but the employees definitely would be angry. If the employees belonged to a union, they might walk off the job.
Other categories to consider adding to the questionnaire include:
![]() Shareholder Confidence.
Shareholder Confidence.
![]() Loss of Financial Control.
Loss of Financial Control.
![]() Customer Service.
Customer Service.
![]() Employee Resignations.
Employee Resignations.
![]() Vendor Relations.
Vendor Relations.
![]() Potential Liability.
Potential Liability.
![]() Competitive Advantage.
Competitive Advantage.
![]() Health Hazard.
Health Hazard.
![]() Additional Cost of Credit.
Additional Cost of Credit.
![]() Additional Cost of Advertising to Rebuild Company Image and Reliability.
Additional Cost of Advertising to Rebuild Company Image and Reliability.
![]() Cost to Acquire New Software and to Re-Create Databases.
Cost to Acquire New Software and to Re-Create Databases.
![]() Damage to Brand Image.
Damage to Brand Image.
![]() Potential Reduction in Value of Company Stock Shares.
Potential Reduction in Value of Company Stock Shares.
The next section on the sample questionnaire is used to document any documents or other vital records that are critical for the success of the function. Departments that originate, use, or store vital business records must be identified. This information can be used to develop protection plans for this data. It can also identify documents that should be properly destroyed instead of stored on-site.
Next on the sample questionnaire is a section in which to document critical non-IT devices that may be difficult or impossible to replace. This can spawn a project to modify the function to eliminate these unique devices (and thereby reduce the chance of a business function outage due to the failure of a special machine).
The last question on the sample questionnaire offers the department an opportunity to give a subjective rating of the importance of a specific function to the overall functioning of the department. This information will be used in conjunction with the financial impact data to help prioritize the functions to be restored in the event of a disaster.
Once the questions have all been determined, develop a set of written instructions to be distributed with the questionnaire. The instructions should explain how every field on the form will be used and what the respondent should fill in for each field. Ideally, include a telephone number for someone on the BIA project team to quickly answer questions; the quicker you can resolve questions the more likely the questionnaire will be completed.
COLLECT THE DATA
Once the questionnaire has been developed, you need to distribute it to the various departments. An important first step is to meet with each of the department leaders and help them to draft the list of vital business functions within their domains. Use this list to provide a numbered stack of questionnaires. Assign a number to each person the department leaders indicate should receive one. An important management tool is a log of which form number went to which person. This is used to verify that all of the forms are returned.
Next, coordinate a series of meetings with the various departments to review the questionnaire and give people a chance to ask questions. While this will be time consuming, it will speed up the process by helping to prevent the completion of the questionnaire from getting sidetracked. Try to keep the groups smaller than 20 people. This provides opportunities to ask questions. During these meetings:
![]() Explain the purpose of the BIA and how it will help the company and their department—sell the concept to them!
Explain the purpose of the BIA and how it will help the company and their department—sell the concept to them!
![]() Provide copies of the letter from the executive sponsor that supports this project; this serves to reinforce the importance of this project.
Provide copies of the letter from the executive sponsor that supports this project; this serves to reinforce the importance of this project.
![]() If possible, ask the executive sponsor to drop by the meetings for a brief word of “encouragement.”
If possible, ask the executive sponsor to drop by the meetings for a brief word of “encouragement.”
![]() Provide copies of the questionnaires, along with a printed explanation of what each item means.
Provide copies of the questionnaires, along with a printed explanation of what each item means.
![]() Walk through every item in the questionnaire and provide examples of how they might be filled in.
Walk through every item in the questionnaire and provide examples of how they might be filled in.
![]() Set a deadline (typically one week) for the questionnaire to be completed and returned.
Set a deadline (typically one week) for the questionnaire to be completed and returned.
Check vacation and travel schedules to ensure that all respondents will be available to complete the questionnaire. If not, make sure that an appropriate substitute is identified.
For collecting data from departments with a limited number of functions and highly paid employees (such as the legal department), it may be more time and cost effective to have the BIA team interview critical members of the department and fill out the questionnaires for them.
As questionnaires are returned to the BIA team, carefully track which teams have returned their questionnaires. Visit any department you think might be less than diligent in filling out the questionnaires. Make the visit a friendly reminder of the deadline and use it as an opportunity to answer any questions or respond to any problems with the questionnaire. As the deadline for each department passes, visit each department that has not returned the questionnaires to see if help is needed and to encourage them to complete the form. As the forms are returned, be sure to check them for:
![]() Clarity. Ensure that you understand the answers.
Clarity. Ensure that you understand the answers.
![]() Completeness. Return any incomplete forms and ask if department members need help in completing the questionnaire. If only a few items are missing, it is likely that they simply did not understand them.
Completeness. Return any incomplete forms and ask if department members need help in completing the questionnaire. If only a few items are missing, it is likely that they simply did not understand them.
![]() Other. Review any items answered “Other” to see if one of the existing categories may have been a fit or if a new category is needed.
Other. Review any items answered “Other” to see if one of the existing categories may have been a fit or if a new category is needed.
Reporting the Results
Once all of the questionnaires have been returned, it is time to compile the reports. The reports are organized into a hierarchy of reports, starting with each business function. Depending on the size of the organization, you might have several layers between each function and the overall organization. A typical organization will use the following levels for the BIA report:
1. Function
2. Workgroup
3. Department
4. Business Unit
5. Overall Organization
The example below shows a workgroup report for the A/R function within the Accounting department. Each business function is listed along the left side, with the time ranges used in the questionnaire across the top. Each column then shows the impact if that function is unavailable for that amount of time.
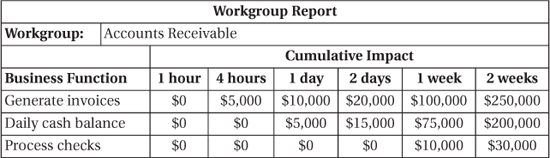
Once the workgroup report is completed, you should meet with everyone who responded to the questionnaire and their next level manager. A copy of the report is provided to all participants, which is then reviewed with the group one line at a time. The entire group then must reach a consensus about each line item. The BIA analyst’s job is to remain nonjudgmental and to only guide the discussion. During this process, the collective knowledge of the group is used to correct any errors, point out any missing functions, and discuss options that may be available to reduce potential losses.
The amount of time a vital business function can tolerate downtime and at what cost determines the disaster recovery strategy. The less tolerant a business function is to an outage, the more expensive the disaster recovery strategy must be and the more urgent it becomes that business continuity mitigation is implemented.
Every line in the report should either be validated or updated. In this way, the BIA report is the product of both the team and that workgroup’s management. The entire discussion is important, because the workgroup’s management must defend the workgroup’s consensus at the next level of data validation.
This process is then repeated at the next level. If the next level is a department, then the impact of the loss of each workgroup that makes up the department is reviewed by each workgroup manager along with the manager of the department. As each team reviews its report, expect vigorous discussion about what is important and the impact on the organization. For many managers this process is very educational. Many are often surprised at the impact some functions really have and how vulnerable they are to a loss of that function.
An important consequence of performing a BIA is to get the different departments at least thinking about how their functions fit within the mission of the organization, which makes improvements easier to identify.
CONCLUSION
After reading this chapter, you should now be able to determine which functions are vital to the success of your organization, as well as the priority in which these functions should be restored. Performing a BIA can be a tricky process politically, as each department within an organization will naturally believe that its functions are the most critical and may be hesitant to share details with someone outside of the department. A successful BIA requires the following:
![]() Strong and vocal support from senior management.
Strong and vocal support from senior management.
![]() A capable project leader.
A capable project leader.
![]() A well-crafted questionnaire.
A well-crafted questionnaire.
![]() Complete and honest answers from each department.
Complete and honest answers from each department.
With a complete and accurate BIA in hand, you are now ready to begin evaluating the actual risks to your organization’s vital functions and develop a strategy for dealing with them.