
10. Estimation

Estimation is one of the simplest, yet most frightening activities that software professionals face. So much business value depends on it. So much of our reputations ride on it. So much of our angst and failure are caused by it. It is the primary wedge that has been driven between business people and developers. It is the source of nearly all the distrust that rules that relationship.
In 1978, I was the lead developer for a 32K embedded Z-80 program written in assembly language. The program was burned onto 32 1K × 8 EEprom chips. These 32 chips were inserted into three boards, each of which held 12 chips.
We had hundreds of devices in the field, installed in telephone central offices all over the United States. Whenever we fixed a bug or added a feature, we’d have to send field service techs to each of those units and have them replace all 32 chips!
This was a nightmare. The chips and the boards were fragile. The pins on the chips could bend and break. The constant flexing of the boards could damage solder joints. The risk of breakage and error were enormous. The cost to the company was far too high.
My boss, Ken Finder, came to me and asked me to fix this. What he wanted was a way to make a change to a chip that did not require all the other chips to change. If you’ve read my books, or heard my talks, you know I rant a lot about independent deployability. This is where I first learned that lesson.
Our problem was that the software was a single linked executable. If a new line of code was added to the program, all the addresses of the following lines of code changed. Since each chip simply held 1K of the address space, the contents of virtually all the chips would change.
The solution was pretty simple. Each chip had to be decoupled from all the others. Each had to be turned into an independent compilation unit that could be burned independently of all the others.
So I measured the sizes of all the functions in the application and wrote a simple program that fit them, like a jigsaw puzzle, into each of the chips, leaving 100 bytes of space or so for expansion. At the beginning of each chip I put a table of pointers to all the functions on that chip. At boot-up these pointers were moved into RAM. All the code in the system was changed so that functions were called only through these RAM vectors and never directly.
Yes, you got it. The chips were objects, with vtables. All functions were polymorphically deployed. And, yes, this is how I learned some of the principles of OOD, long before I knew what an object was.
The benefits were enormous. Not only could we deploy individual chips, we could also make patches in the field by moving functions into RAM and rerouting the vectors. This made field debugging and hot patching much easier.
But I digress. When Ken came to me and asked me to fix this problem he suggested something about pointers to functions. I spent a day or two formalizing the idea and then presented him with a detailed plan. He asked me how long it would take, and I responded that it would take me about a month.
It took three months.
I’ve only been drunk two times in my life, and only really drunk once. It was at the Teradyne Christmas party in 1978. I was 26 years old.
The party was held at the Teradyne office, which was mostly open lab space. Everybody got there early, and then there was a huge blizzard that prevented the band and the caterer from getting there. Fortunately there was plenty of booze.
I don’t remember much of that night. And what I do remember I wish I didn’t. But I will share one poignant moment with you.
I was sitting cross-legged on the floor with Ken (my boss, who was all of 29 years old at the time and not drunk) weeping about how long the vectorization job was taking me. The alcohol had released my pent up fears and insecurities about my estimate. I don’t think my head was in his lap, but my memory just isn’t very clear about that kind of detail.
I do remember asking him if he was mad at me, and if he thought it was taking me too long. Although the night was a blur, his response has remained clear through the following decades. He said, “Yes, I think it’s taken you a long time, but I can see that you are working hard on it, and making good progress. It’s something we really need. So, no, I’m not mad.”
What Is an Estimate?
The problem is that we view estimates in different ways. Business likes to view estimates as commitments. Developers like to view estimates as guesses. The difference is profound.
A Commitment
A commitment is something you must achieve. If you commit to getting something done by a certain date, then you simply have to get it done by that date. If that means you have to work 12 hours a day, on weekends, skipping family vacations, then so be it. You’ve made the commitment, and you have to honor it.
Professionals don’t make commitments unless they know they can achieve them. It’s really as simple as that. If you are asked to commit to something that you aren’t certain you can do, then you are honor bound to decline. If you are asked to commit to a date that you know you can achieve, but would require long hours, weekends, and skipped family vacations, then the choice is yours; but you’d better be willing to do what it takes.
Commitment is about certainty. Other people are going to accept your commitments and make plans based upon them. The cost of missing those commitments, to them, and to your reputation, is enormous. Missing a commitment is an act of dishonesty only slightly less onerous than an overt lie.
An Estimate
An estimate is a guess. No commitment is implied. No promise is made. Missing an estimate is not in any way dishonorable. The reason we make estimates is because we don’t know how long something will take.
Unfortunately, most software developers are terrible estimators. This is not because there’s some secret skill to estimating—there’s not. The reason we are often so bad at estimating is because we don’t understand the true nature of an estimate.
An estimate is not a number. An estimate is a distribution. Consider:
Mike: “What is your estimate for completing the Frazzle task?”
Peter: “Three days.”
Is Peter really going to be done in three days? It’s possible, but how likely is it? The answer to that is: We have no idea. What did Peter mean, and what has Mike learned? If Mike comes back in three days, should he be surprised if Peter is not done? Why would he be? Peter has not made a commitment. Peter has not told him how likely three days is versus four days or five days.
What would have happened if Mike had asked Peter how likely his estimate of three days was?
Mike: “How likely is it that you’ll be done in three days?
Peter: “Pretty likely.”
Mike: “Can you put a number on it?”
Peter: “Fifty or sixty percent.”
Mike: “So there’s a good chance that it’ll take you four days.”
Peter: “Yes, in fact it might even take me five or six, though I doubt it.”
Mike: “How much do you doubt it?”
Peter: “Oh, I don’t know ... I’m ninety-five percent certain I’ll be done before six days have passed.”
Mike: “You mean it might be seven days?”
Peter: “Well, only if everything goes wrong. Heck, if everything goes wrong, it could take me ten or even eleven days. But it’s not very likely that so much will go wrong.”
Now we’re starting to hone in on the truth. Peter’s estimate is a probability distribution. In his mind, Peter sees the likelihood of completion like what is shown is Figure 10-1.
Figure 10-1. Probability distribution
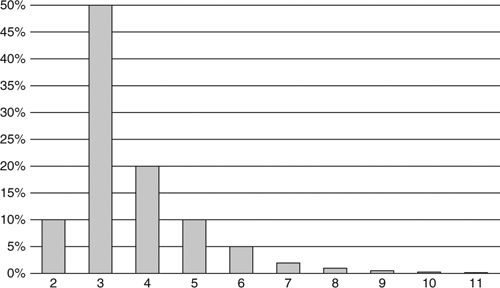
You can see why Peter gave the original estimate as three days. It’s the highest bar on the chart. So in Peter’s mind it is the most likely duration for the task. But Mike sees things differently. He looks at the right-hand tail of the chart and worries that Peter might really take eleven days to finish.
Should Mike be worried about this? Of course! Murphy1 will have his way with Peter, so some things are probably going to go wrong.
Implied Commitments
So now Mike has a problem. He’s uncertain about the time it will take Peter to get the task done. To minimize that uncertainty he may ask Peter for a commitment. This is something the Peter is in no position to give.
Mike: “Peter, can you give me a hard date when you’ll be done?”
Peter: “No, Mike. Like I said, it’ll probably be done in three, maybe four, days.”
Mike: “Can we say four then?”
Peter: “No, it could be five or six.”
So far, everyone is behaving fairly. Mike has asked for a commitment and Peter has carefully declined to give him one. So Mike tries a different tack:
Mike: “OK, Peter, but can you try to make it no more than six days?”
Mike’s plea sounds innocent enough, and Mike certainly has no ill intentions. But what, exactly, is Mike asking Peter to do? What does it mean to “try”?
We talked about this before, back in Chapter 2. The word try is a loaded term. If Peter agrees to “try” then he is committing to six days. There’s no other way to interpret it. Agreeing to try is agreeing to succeed.
What other interpretation could there be? What is it, precisely, that Peter is going to do in order to “try”? Is he going to work more than eight hours? That’s clearly implied. Is he going to work weekends? Yes, that’s implied too. Will he skip family vacations? Yes, that also part of the implication. All of those things are part of “trying.” If Peter doesn’t do those things, then Mike could accuse him of not trying hard enough.
Professionals draw a clear distinction between estimates and commitments. They do not commit unless they know for certain they will succeed. They are careful not to make any implied commitments. They communicate the probability distribution of their estimates as clearly as possible, so that managers can make appropriate plans.
PERT
In 1957, the Program Evaluation and Review Technique (PERT) was created to support the U.S. Navy’s Polaris submarine project. One of the elements of PERT is the way that estimates are calculated. The scheme provides a very simple, but very effective way to convert estimates into probability distributions suitable for managers.
When you estimate a task, you provide three numbers. This is called trivariate analysis:
• O: Optimistic Estimate. This number is wildly optimistic. You could only get the task done this quickly if absolutely everything went right. Indeed, in order for the math to work this number should have much less than a 1% chance of occurrence.2 In Peter’s case, this would be 1 day, as shown in Figure 10-1.
• N: Nominal Estimate. This is the estimate with the greatest chance of success. If you were to draw a bar chart, it would be the highest bar, as shown in Figure 10-1. It is 3 days.
• P: Pessimistic Estimate. Once again this is wildly pessimistic. It should include everything except hurricanes, nuclear war, stray black holes, and other catastrophes. Again, the math only works if this number has much less than a 1% chance of success. In Peter’s case this number is off the chart on the right. So 12 days.
Given these three estimates, we can describe the probability distribution as follows:
• ![]()
μ is the expected duration of the task. In Peter’s case it is (1+12+12)/6, or about 4.2 days. For most tasks this will be a somewhat pessimistic number because the right-hand tail of the distribution is longer than the left-hand tail.3
• ![]()
σ is the standard deviation4 of the probability distribution for the task. It is a measure of how uncertain the task is. When this number is large, the uncertainty is large too. For Peter this number is (12 – 1)/6, or about 1.8 days.
Given Peter’s estimate of 4.2/1.8, Mike understands that this task will likely be done within five days but might also take 6, or even 9, days to complete.
But Mike is not just managing one task. He’s managing a project of many tasks. Peter has three of those tasks that he must work on in sequence. Peter has estimated these tasks as shown in Table 10-1.
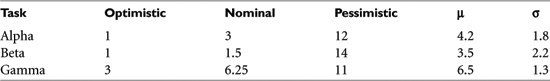
What’s up with that “beta” task? It looks like Peter is pretty confident about it, but that something could possibly go wrong that would derail him significantly. How should Mike interpret that? How long should Mike plan for Peter to complete all three tasks?
It turns out that, with a few simple calculations, Mike can combine all of Peter’s tasks and come up with a probability distribution for the entire set of tasks. The math is pretty straightforward:
• ![]()
For any sequence of tasks the expected duration of that sequence is the simple sum of all the expected durations of the tasks in that sequence. So if Peter has three tasks to complete, and their estimates are 4.2/1.8, 3.5/2.2, and 6.5/1.3, then Peter will likely be done with all three in about 14 days: 4.2 + 3.5 + 6.5.
• ![]()
The standard deviation of the sequence is the square root of the sum of the squares of the standard deviations of the tasks. So the standard deviation for all three of Peter’s tasks is about 3.
(1.82 + 2.22 + 1.32)1/2 =
(3.24 + 2.48 + 1.69)1/2 =
9.771/2 = ~ 3.13
This tells Mike that Peter’s tasks will likely take 14 days, but could very well take 17 days (1σ) and could possibly even take 20 days (2σ). It could even take longer, but that’s pretty unlikely.
Look back at the table of estimates. Can you feel the pressure to get all three tasks done in five days? After all, the best-case estimates are 1, 1, and 3. Even the nominal estimates only add up to 10 days. How did we get all the way up to 14 days, with a possibility of 17 or 20? The answer is that the uncertainty in those tasks compounds in a way that adds realism to the plan.
If you are a programmer of more than a few years’ experience, you’ve likely seen projects that were estimated optimistically, and that took three to five times longer than hoped. The simple PERT scheme just shown is one reasonable way to help prevent setting optimistic expectations. Software professionals are very careful to set reasonable expectations despite the pressure to try to go fast.
Estimating Tasks
Mike and Peter were making a terrible mistake. Mike was asking Peter how long his tasks would take. Peter gave honest trivariate answers, but what about the opinions of his teammates? Might they have a different idea?
The most important estimation resource you have are the people around you. They can see things that you don’t. They can help you estimate your tasks more accurately than you can estimate them on your own.
Wideband Delphi
In the 1970s Barry Boehm introduced us to an estimation technique called “wideband delphi.”5 There have been many variations over the years. Some are formal, some are informal; but they all have one thing in common: consensus.
The strategy is simple. A team of people assemble, discuss a task, estimate the task, and iterate the discussion and estimation until they reach agreement.
The original approach outlined by Boehm involved several meetings and documents that involve too much ceremony and overhead for my tastes. I prefer simple low-overhead approaches such as the following.
Flying Fingers
Everybody sits around a table. Tasks are discussed one at a time. For each task there is discussion about what the task involves, what might confound or complicate it, and how it might be implemented. Then the participants put their hands below the table and raise 0 to 5 fingers based on how long they think the task will take. The moderator counts 1-2-3, and all the participants show their hands at once.
If everyone agrees, then they go on to the next task. Otherwise they continue the discussion to determine why they disagree. They repeat this until they agree.
Agreement does not need to be absolute. As long as the estimates are close, it’s good enough. So, for example, a smattering of 3s and 4s is agreement. However if everyone holds up 4 fingers except for one person who holds up 1 finger, then they have something to talk about.
The scale of the estimate is decided on at the beginning of the meeting. It might be the number of days for a task, or it might be some more interesting scale such as “fingers times three” or “fingers squared.”
The simultaneity of displaying the fingers is important. We don’t want people changing their estimates based on what they see other people do.
Planning Poker
In 2002 James Grenning wrote a delightful paper6 describing “Planning Poker.” This variation of wideband delphi has become so popular that several different companies have used the idea to make marketing giveaways in the form of planning poker card decks.7 There is even a web site named planningpoker.com that you can use to do planning poker on the Net with distributed teams.
The idea is very simple. For each member of the estimation team, deal a hand of cards with different numbers on them. The numbers 0 through 5 work fine, and make this system logically equivalent to flying fingers.
Pick a task and discuss it. At some point the moderator asks everyone to pick a card. The members of the team pull out a card that matches their estimate and hold it up with the back facing outward so that no one else can see the value of the card. Then the moderator tells everyone to show their cards.
The rest is just like flying fingers. If there is agreement, then the estimate is accepted. Otherwise the cards are returned to the hand, and the players continue to discuss the task.
Much “science” has been dedicated to choosing the correct card values for a hand. Some folks have gone so far as to use cards based on a Fibonacci series. Others have included cards for infinity and question mark. Personally, I think five cards labeled 0, 1, 3, 5, 10 are sufficient.
Affinity Estimation
A particularly unique variation of wideband delphi was shown to me several years ago by Lowell Lindstrom. I’ve had quite a bit of good luck with this approach with various customers and teams.
All the tasks are written onto cards, without any estimates showing. The estimation team stands around a table or a wall with the cards spread out randomly. The team members do not talk, they simply start sorting the cards relative to one another. Tasks that take longer are moved to the right. Smaller tasks move to the left.
Any team member can move any card at any time, even if it has already been moved by another member. Any card moved more than η times is set aside for discussion.
Eventually the silent sorting peters out and discussion can begin. Disagreements about the ordering of the cards are explored. There may be some quick design sessions or some quick hand-drawn wire frames to help gain consensus.
The next step is to draw lines between the cards that represent bucket sizes. These buckets might be in days, weeks, or points. Five buckets in a Fibonacci sequence (1, 2, 3, 5, 8) is traditional.
Trivariate Estimates
These wideband delphi techniques are good for choosing a single nominal estimate for a task. But as we stated earlier, most of the time we want three estimates so that we can create a probability distribution. The optimistic and pessimistic values for each task can be generated very quickly using any of the wideband delphi variants. For example, if you are using planning poker, you simply ask the team to hold up the cards for their pessimistic estimate and then take the highest. You do the same for the optimistic estimate and take the lowest.
The Law of Large Numbers
Estimates are fraught with error. That’s why they are called estimates. One way of managing error is to take advantage of the Law of Large Numbers.8 An implication of this law is that if you break up a large task into many smaller tasks and estimate them independently, the sum of the estimates of the small tasks will be more accurate than a single estimate of the larger task. The reason for this increase in accuracy is that the errors in the small tasks tend to integrate out.
Frankly, this is optimistic. Errors in estimates tend toward underestimation and not overestimation, so the integration is hardly perfect. That being said, breaking large tasks into small ones and estimating the small ones independently is still a good technique. Some of the errors do integrate out, and breaking the tasks up is a good way to understand those tasks better and uncover surprises.
Conclusion
Professional software developers know how to provide the business with practical estimates that the business can use for planning purposes. They do not make promises that they can’t keep, and they don’t make commitments that they aren’t sure they can meet.
When professionals make commitments, they provide hard numbers, and then they make those numbers. However, in most cases professionals do not make such committments. Rather, they provide probabilistic estimates that describe the expected completion time and the likely variance.
Professional developers work with the other members of their team to achieve consensus on the estimates that are given to management.
The techniques described in this chapter are examples of some of the different ways that professional developers create practical estimates. These are not the only such techniques and are not necessarily the best. They are simply techniques that I have found to work well for me.
Bibliography
[McConnell2006]: Steve McConnell, Software Estimation: Demystifying the Black Art, Redmond, WA: Microsoft Press, 2006.
[Boehm81]: Barry W. Boehm, Software Engineering Economics, Upper Saddle River, NJ: Prentice Hall, 1981.
[Grenning2002]: James Grenning, “Planning Poker or How to Avoid Analysis Paralysis while Release Planning,” April 2002, http://renaissancesoftware.net/papers/14-papers/44-planing-poker.html