
Chapter 11
Case-Study Application II: ARIPAR-GIS
G. Antonioni
A. Necci
G. Spadoni
V. Cozzani Department of Civil, Chemical, Environmental, and Materials Engineering, University of Bologna, Bologna, Italy
Abstract
This chapter demonstrates the detailed quantitative analysis of Natech risk by applying the ARIPAR-GIS software introduced in Chapter 9 to two case studies. Case study 1 analyzes earthquake-induced Natech risks at a hazardous facility and case study 2 studies the impact of floods. Individual and societal risk were calculated and compared to the risk levels obtained without considering Natech scenarios. The results confirm the significant influence that Natech risks may have on the overall risk at a hazardous installation.
Keywords
Natech
QRA
ARIPAR-GIS
earthquake
tsunami
individual risk
societal risk
This chapter demonstrates the detailed quantitative analysis of Natech risk by applying the ARIPAR-GIS software introduced in Chapter 9 to two case studies. Case study 1 analyzes earthquake-induced Natech risks at a hazardous facility and case study 2 studies the impact of floods. Individual and societal risk were calculated and compared to the risk levels obtained without considering Natech scenarios. The results confirm the significant influence that Natech risks may have on the overall risk at a hazardous installation.
11.1. Introduction
This chapter discusses the analysis of two Natech case studies to understand the importance of the assessment of industrial risk associated with natural events. The first case study is concerned with the analysis of Natech accidents triggered by earthquakes, the second one with accidents triggered by floods. The general approach to quantitative risk analysis outlined in Chapter 7 and the specific procedure summarized in Chapter 9 (Antonioni et al., 2009; Cozzani et al., 2014) were applied to the case study calculations. The use of a software tool was a necessary step in the process and the Natech module of the ARIPAR-GIS software, introduced in Chapter 9, was applied (Antonioni et al., 2007). The two case studies were based on layouts and process equipment data derived from those of existing chemical, and oil and gas facilities.
11.2. Case study 1: Natech Scenarios Triggered by Earthquakes
The first simplified case study is dedicated to the assessment of the contribution of earthquake-induced Natech scenarios to the overall individual and societal risk. The layout used for the case study is presented in Fig. 11.1. As shown in this figure, eight atmospheric tanks were considered in the analysis. For the sake of simplicity, all the tanks were assumed to have the same volume (3500 m3) and the same content (2000 t of ethanol).

In order to simplify the analysis, a single scenario was associated with each equipment item and was considered as the only possible primary and/or secondary event. The scenarios were defined on the basis of credible accidents involving the equipment items considered, also following the suggestions given by the Purple Book (Uijt de Haag and Ale, 1999). The case study mainly aimed to analyze events triggered by earthquakes, thus only severe scenarios were taken into account. The instantaneous release of the entire content of the tank was considered as the reference scenario. A frequency of 3.1 × 10⁻⁷ events/year was assumed for internal failures (conventional failures not induced by earthquakes). With respect to earthquakes, a reference event with a PGA of 0.224 g and a return period of 475 years was assumed. The damage probability was calculated using the probit models listed in Table 9.2, and it was equal to 0.026 for each of the eight tanks in the case study. A total of 255 (28–1) possible Natech accident combinations were assessed. The final outcome of the scenario was pool fire of the entire catch-basin area.
The conventional consequence-analysis models described in the Yellow Book (van den Bosch and Weterings, 2005) were used for the assessment. For calculating the vulnerability of the surrounding population, the probit models in Table 11.1 were used. A fictitious value of 5 persons/ha and a homogeneous density were assumed for the population distribution.
Table 11.1
Probit Functions for Human Vulnerability Used in the Case Studies (Mannan, 2005; van den Bosch et al., 1992)
| Scenario | Target | Probit Equation | Dose, D | Dose Units |
| Radiation | Human | Y = −14.9 + 2.56 ln(D) | I1.33·te | I: kW/m2 te: s |
| Overpressure | Human | Y = 1.47 + 1.37 ln(D) | ps | ps: psig |
| Toxic release: NH3 | Human | Y = −9.82 + 0.71 ln(D) | C2∙te | C: ppm te: min |

Y, probit value; I, radiation intensity; ps, peak static overpressure; C, toxic concentration, te, exposure time.
The results of the quantitative risk assessment using ARIPAR-GIS are shown in Fig. 11.2, both in terms of local specific individual risk (LSIR) (A) and of societal risk (B). As is clearly visible from this figure, the earthquake causes a significant increase in individual and societal risk levels, in particular for nonanchored tanks but also for those that are anchored, albeit at a somewhat lesser level. Two effects are evident from Fig. 11.2 in accordance with theoretical considerations:
1. An increase in the values of the frequency, F, corresponding to the reference scenarios chosen for each unit: this is caused by the increase in the overall frequency of the reference scenarios due to the possibility that the equipment may fail also due to an earthquake.
2. An increase in the maximum value of expected fatalities, N, caused by the assumption that seismic events may trigger scenarios simultaneously involving more than one unit. This assumption is never introduced in conventional QRA unless domino events are considered (Cozzani et al., 2005; Reniers and Cozzani, 2013). Clearly, assuming that several reference scenarios may take place at the same time results in overall events having a higher overall value of expected fatalities than that of the single reference scenarios.

Figure 11.2 Individual and Societal Risk for Case Study 1
(A) LSIR contours (events/year), (B) societal risk with (solid lines) and without (dashed lines) the consideration of possible accident scenarios due to earthquake impact. The impact of anchoring tanks as a safety measure is also shown. Adapted from Antonioni et al. (2007).
(A) LSIR contours (events/year), (B) societal risk with (solid lines) and without (dashed lines) the consideration of possible accident scenarios due to earthquake impact. The impact of anchoring tanks as a safety measure is also shown. Adapted from Antonioni et al. (2007).
This case study showed that the consideration of accident scenarios due to earthquakes adds important contributions to the overall values of these risk indices.
11.3. Case study 2: Natech Scenarios Triggered by Floods
11.3.1. Layout and Vessel Features
In order to demonstrate the application of the methodology and to understand the importance of considering flood-induced Natech scenarios, a case-study QRA with ARIPAR-GIS was carried out. The layout of the industrial facility selected for the study is shown in Fig. 11.3. It should be noted that in the layout both atmospheric and pressurized tanks are present.
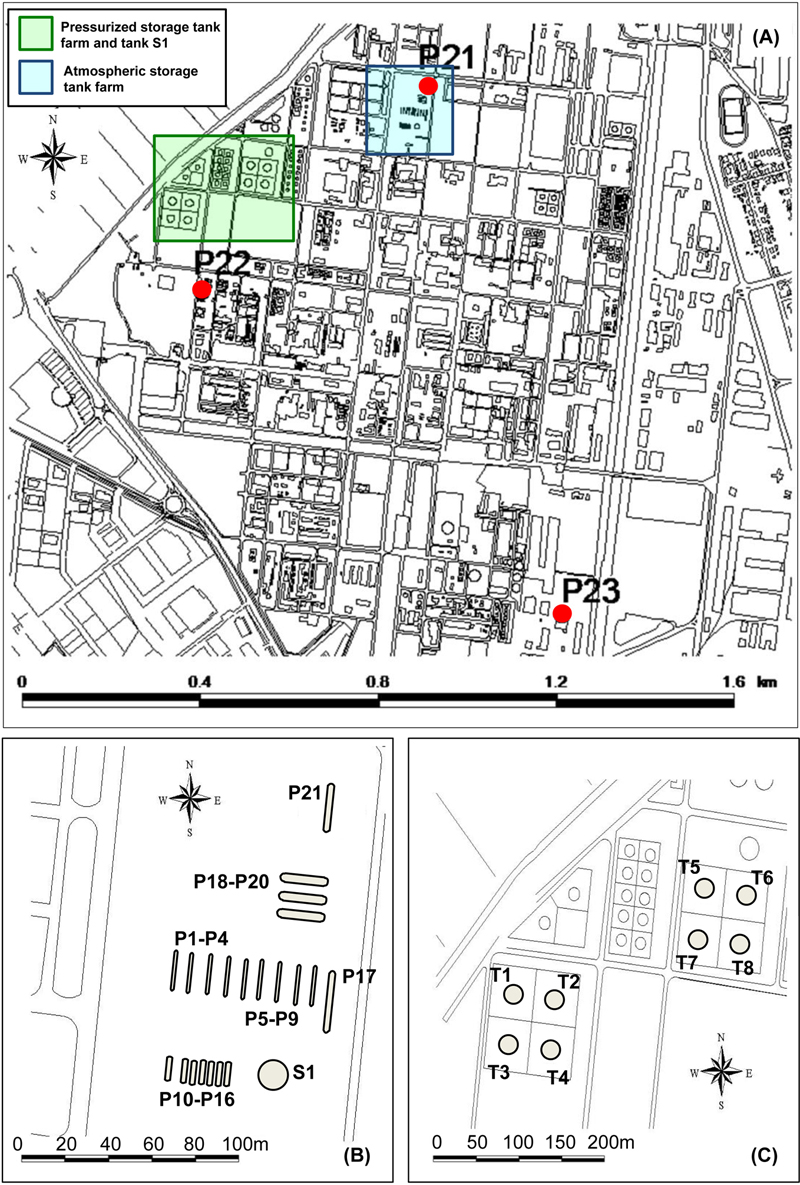
Figure 11.3 Layout Considered for Case Study 2
(A) Overview of the industrial area, position of the tank farms, and location of pressurized tanks P21–P23; (B) pressurized tank farm and storage tank S1; (C) atmospheric tank farm.
(A) Overview of the industrial area, position of the tank farms, and location of pressurized tanks P21–P23; (B) pressurized tank farm and storage tank S1; (C) atmospheric tank farm.
Table 11.2 lists the features of the vessels considered and their inventories of hazardous substances. Both horizontal and vertical tanks were included in the analysis. All the horizontal vessels were assumed to be supported on a concrete base (0.25 m above ground level) that may provide protection from floods with low water depths.
Table 11.2
Main Features of the Vessels Considered in Case Study 2 With Ambient Temperature 293 K
| Vessel Features | Pressurized Vessels | Atmospheric Vessels | ||||||
| P1–P9 | P10–P16 | P17 | P18–P20 | P21–P23 | S1 | T1–T4 | T5–T8 | |
| Nominal capacity (m3) | 50 | 30 | 115 | 150 | 100 | 3179 | 6511 | 6511 |
| Diameter (m) | 2.7 | 2.4 | 2.75 | 3.2 | 2.8 | 15 | 24 | 24 |
| Lengtha /heightb (m) | 10 | 6.5 | 20.1 | 19.4 | 18 | 18 | 14.4 | 14.4 |
| Shell thickness (mm) | 23 | 21 | 24 | 27 | 24 | 12.5 | 12.5 | 12.5 |
| Vessel tare weight (metric ton) | 12.3 | 5.9 | 29.2 | 36.1 | 26.2 | 110 | 165 | 165 |
| Saddle parameter (m) | 1.48 | 1.38 | 1.58 | 1.78 | 1.58 | — | — | — |
| Filling level | 90% | 90% | 90% | 90% | 90% | 75% | 75% | 75% |
| Substance contained | Propylene | Propane | LPGc | Ammonia | Chlorine | Organic solvent | Gasoline | Benzene |
| Physical state | Liquefied gas | Liquefied gas | Liquefied gas | Liquefied gas | Liquefied gas | Liquid | Liquid | Liquid |
| Pressure (bar) | 8 | 8.5 | 2 | 8.5 | 6.7 | 1.05 | 1.05 | 1.05 |
| Liquid density (kg/m3) | 615 | 450 | 550 | 600 | 1400 | 650 | 750 | 877 |
| Vapor density (kg/m3) | 13.8 | 15.4 | 4.8 | 4.9 | 19.3 | 0.97d | 0.97d | 0.97d |
| Inventory (metric ton) | 32 | 12 | 59 | 84 | 140 | 1550 | 3656 | 4275 |

Adapted from Antonioni et al. (2015).
a Horizontal vessel.
b Vertical vessel.
c Assumed as pure butane.
d Average density of the purge gas (e.g., nitrogen blanketing), not relevant for model application
11.3.2. Workers and Surrounding Population
The industrial facility considered is organized for continuous operation 24 h/day. Thus, inside the site, a constant presence of 100 workers was considered. The workers were assumed to be evenly distributed in the plant area. A 50% probability of being present outdoors was considered.
Census data were used as the basis for societal-risk calculation. Fig. 11.4 shows the distribution considered for the resident population. Daily averages for presence probability of resident population were considered (Uijt de Haag and Ale, 1999; Bonvicini et al., 2012).

Figure 11.4 Density of the Resident Population in the Surroundings of the Industrial Area Adapted from Antonioni et al. (2015).
11.3.3. Flood Scenarios
The flood scenarios considered in case study 2 are summarized in Table 11.3. Four reference scenarios were selected in order to consider different types of flood waves. In particular, extremely severe conditions were assumed for the first two reference scenarios (Scenario 1 and Scenario 2). In the first scenario, high-depth flooding with limited speed was taken into account. In contrast, in the second scenario a “flash-flood,” with high speed but low water depth was assumed. Both conditions are associated with low frequency values (see Table 11.3). The other reference scenarios were associated with lower-severity flood conditions having a lower return time, that is, they occur more frequently. The defined reference flood scenarios allow the assessment of the impact of different types of floods, with different damage potential and expected frequency.
Table 11.3
Flood Reference Scenarios Defined for Case Study 2
| Flood Conditions | Return Time (Year) | Flood Frequency (1/Year) | Flood Depth (m) | Flood Velocity (m/s) |
| Scenario 1 | 500 | 2.0 × 10⁻³ | 2.00 | 0.5 |
| Scenario 2 | 500 | 2.0 × 10⁻³ | 0.50 | 2 |
| Scenario 3 | 200 | 5.0 × 10⁻³ | 1.15 | 0.75 |
| Scenario 4 | 30 | 3.33 × 10⁻² | 0.75 | 0.5 |

Adapted from Antonioni et al. (2015).
11.3.4. Individual and Societal Risk Calculated for Conventional Scenarios
In order to understand the importance of Natech scenarios triggered by floods, as in the previous case study a QRA of “conventional” scenarios, due to internal failures at the installation, was performed to obtain reference values for individual and societal risk. The expected frequency of the top events was defined according to the Purple Book (Uijt de Haag and Ale, 1999). Table 11.4 shows the end-point frequencies of each scenario considered for the risk sources analyzed. The consequences of the end-point events listed in the table were assessed using literature models (Mannan, 2005; CCPS, 2000; van Den Bosch and Weterings, 2005). The physical effects calculated were then implemented in the ARIPAR-GIS software.
Table 11.4
End-Point Scenarios Considered for the QRA of Internal Release Events at a Hazardous Facility
| Tank ID | Loss of Containment Event | Final Outcome | Frequency (1/Year) |
| T1–T8 and S1 | Instantaneous release into the catch basin of the total inventory | Pool fire | 4.5 × 10⁻⁶ |
| P1–P17 | Release in 10 min of the total inventory | Flash fire of propane, propylene, or LPG | 4.5 × 10⁻⁷ |
| P18–P23 | Release in 10 min of the total inventory | Toxic cloud of ammonia or chlorine | 5.0 × 10⁻⁷ |

Adapted from Antonioni et al. (2015).
Fig. 11.5 shows the individual risk calculated for the conventional scenarios included in the case study. The risk contour at the threshold value of 10−6 1/year lies inside the industrial area, while only lower individual risk levels are present in the residential areas. A Potential Life Loss (PLL) of 8.84 fatalities per thousand years was calculated. These results are the baseline values for the comparison with the risk levels calculated for the accident scenarios triggered by floods.

Figure 11.5 Individual-Risk Contours (1/Year) Calculated for Accident Scenarios Deriving From Conventional Hazmat Release Events due to Internal Failures
11.3.5. Individual and Societal Risk Including Flood-Induced Scenarios
The methodology for the quantitative assessment of Natech scenarios in QRA studies discussed in Chapter 9 was applied to the analysis of the four reference flood events considered. The equipment vulnerability models in Tables 9.3 and 9.4, derived from the studies of Landucci et al. (2012, 2014) were applied in the quantitative calculations of vessel failure probability (cf. Chapter 9). For atmospheric tanks, the approach summarized in Table 9.3 was applied, thus determining the critical filling level (CFL) as a function of the stored substance, tank geometry, and flood conditions. As shown in the table, for all the flood conditions considered, the failure of the atmospheric tanks resulted credible. The failure probabilities given the flood ranged from 1%–5% to 15%–20%, respectively, for the low- and high-severity flood scenarios.
In the case of pressurized horizontal vessels, completely different results were obtained. For these vessels, the fragility model described in Table 9.4 was used. Even in the presence of a high flood velocity, the “critical velocity” is not exceeded for any of the flood reference scenarios listed in Table 11.3 (Landucci et al., 2014). Hence, the tank failure probability was evaluated only according to the estimated CFL, resulting in high values for flood scenario 1 (up to 100% failure probability), while for the other flood scenarios low values of failure probability were obtained (down to 0% failure probability in flood scenario 4). This was due to the fact that the tanks were considered anchored to concrete supports, which limited the lift forces associated with the flood.
On the basis of the calculated equipment failure probabilities, the application of the detailed procedure for Natech QRA discussed in Chapter 9 allowed the calculation of the frequencies and probabilities of scenarios involving the simultaneous damage of more than one equipment item. Fig. 11.6 shows the results of the quantitative risk analysis with ARIPAR-GIS in the presence of Natech scenarios in terms of LSIR contours. Flood scenario 1, in which a high depth of flood water is assumed, resulted in the most critical flood event, leading to the highest number of damaged vessels and accident scenarios. On the basis of the failure frequencies estimated from the equipment vulnerability models, about 30,000 scenarios (over a total number of 232–1 possible combinations) resulted in a frequency above the cut-off value of 10−10 1/year, but only 11,000 of them contributed significantly to the overall risk.

Figure 11.6 Individual-Risk Contours (1/Year) due to Flood-Triggered Accidents
(A) Flood scenario 1, (B) flood scenario 2, (C) flood scenario 3, (D) flood scenario 4. From Antonioni et al. (2015).
(A) Flood scenario 1, (B) flood scenario 2, (C) flood scenario 3, (D) flood scenario 4. From Antonioni et al. (2015).
Flood scenario 2, which can be considered as a flash-flood due to its high water speed and limited depth, does not contribute significantly to the risk indices because several equipment items (in particular pressurized vessels) are mounted on concrete supports having a height comparable to the maximum flood-water depth considered. Thus, for scenario 2, damage was predicted only for the nine atmospheric tanks, and “only” 29–1 = 511 scenarios were considered. Among those, the frequencies of merely 185 were above the cut-off value. Flood scenarios 3 and 4, which concern less severe but more frequent flood events, also resulted in only a low contribution to the overall risk.
Fig. 11.7 compares the F–N curve for societal risk that includes flood Natech scenarios with the one that considers only conventional accident scenarios. The societal risk was calculated assuming a specific population distribution around the industrial area. In the case of flood-induced Natech scenarios, the conservative assumption that the population distribution will not change during a flood was introduced in the calculations.

Figure 11.7 Societal Risk Evaluated for Conventional Scenarios due to Internal Failures and for Flood Scenario 1 Adapted from Antonioni et al. (2015).
The F–N curve that considers Natech events is mainly influenced by the increase in the frequency of loss of containment from chlorine tanks (P21–P23) due to flooding. Only the toxic cloud dispersion of chlorine from the rupture of pressurized vessels P21, P22, and P23 resulted in physical effects sufficiently high to cause harm in the areas where the resident population was present. Since only the reference flood event considered for flood scenario 1 was sufficiently severe to affect these vessels, this was the only flood event that caused changes in the overall societal risk value. The F–N curve that includes Natech scenarios also shows some additional steps at high N values (N > 4000) due to the presence of “combined scenarios,” where the impact of the simultaneous failure of and toxic releases from some, or all, of the chlorine tanks due to the flood event is considered.
The potential life loss (PLL) increases from 8.84 × 10⁻³ fatalities/year to 14.8 fatalities/year when including Natech events due to their higher frequency and severity if compared to conventional accidents.
11.4. Results of the case-study analyses
The results of the case studies demonstrate that Natech scenarios can have a high impact on the risk profile of industrial facilities storing and processing hazardous materials. These significant risk levels are mostly attributable to the rather high calculated values of vessel failure frequencies due to the high frequency of severe natural events estimated on the basis of the return time. This issue is also pointed out in several studies (Landucci et al., 2012, 2014) in which Natech frequencies were compared with baseline frequency values used for component failure in “conventional” QRA. In fact, in areas exposed to natural hazards, the frequencies of such events may reach values that are orders of magnitude higher with respect to those related to component failures due to internal causes (e.g., mechanical failure, corrosion, erosion, rupture induced by vibrations, and so on).
The analyses also showed that atmospheric tanks are the most vulnerable tank category, with possible failures even in the presence of low-severity natural events. Therefore, the results of quantitative risk analysis allow the determination of the most vulnerable equipment items and the units that may lead to most severe accident scenarios. The case studies exemplified that a risk-based approach supports the identification of the most critical items in the plant with respect to several types of natural hazards that may affect a given geographical area. Hence, the results may be used to support risk-informed decision making concerning the protection of industrial sites where hazardous substances are present.
Finally, it is also worth noting that the extremely high level of societal risk in Fig. 11.7 is also due to the assumption that no change in time of the surrounding population’s presence was considered. On the one hand, in the case of earthquakes, flash floods, or floods caused by the sudden rupture of river levees, no time is usually available for warning and evacuation, and the obtained overall risk may therefore be considered realistic. On the other hand, in the case of long rivers for which forecasting models are available, floods due to heavy rains or other adverse weather conditions may be anticipated by several hours or even days. Consequently, for slow-onset flood scenarios there may be time for early warning and evacuation of the population and workers that may significantly change the number of persons exposed to the effects of the flood and of flood-induced Natech scenarios. The final consequences of flood-induced Natech scenarios may therefore be different if the evacuation of the population is considered.
..................Content has been hidden....................
You can't read the all page of ebook, please click here login for view all page.