Profiling and Timing
Gaining insight into what the hardware is doing can be priceless. We like to think of profiling, or performance monitoring tools, as flashlights in an otherwise dark interior of a computer system. It feels as though the more complex the internals of computers get, the darker they get without flashlights.
When we think of systems with Intel® Xeon Phi™ coprocessors, we can think about wanting insights into the activities on each thread or core or coprocessor, and wanting to understand the communication traffic between MPI ranks.
For insight into the activities of a processor or coprocessor, Intel supports event-monitoring registers. On the coprocessor these are similar to some counters on a processor, but with additional abilities for the higher core count, higher threads per core, and wider vectors. Using counters instead of more intrusive techniques (like profiling compiler time option –pg) is critical when dealing with high performance programs. Intrusive methods can be highly misleading because of unexpected side effects of simple profiling on the apparent performance.
We will discuss these counters and some proven formulas to compute commonly desired metrics. The premier tool for access to these counters is the Intel® VTune™ Amplifier XE product. Additionally the open source community has Performance Application Programming Interface (PAPI). PAPI provides a consistent interface and methodology for use of the performance counter hardware found in most major microprocessors including the Intel Xeon Phi coprocessor. PAPI is used by quite a number of open source tools (a list is available on the PAPI Web site, see “For More Information” at the end of this chapter) as well as come commercial products.
For insight into MPI communications between ranks regardless of whether the rank is on a processor or coprocessor, we will introduce the Intel® Trace Analyzer and Collector (ITAC).
We will not cover the actual usage of any of these tools, as each one could easily occupy an entire book. Instead, we’ll highlight the key things to entice you to learn more, and focus on things specific to profiling the Intel Xeon Phi coprocessor. If you are already of a user of any of these tools, this will be sufficient to get an appreciation for the key coprocessor-specific items. If you are not a user of these tools, we will give a feel for why you should consider becoming a user. There are online tutorials and documentation available for learning; see the “For More Information” section at the end of this chapter.
Software performance optimization can occur at many levels: application tuning, system tuning, operating system tuning, and so on. Generally, a top-down approach is the most efficient: tuning of the system first, then optimizing the algorithms of the application, and then tuning at the microarchitecture level. System tuning, including tuning of the operating system, is normally done to remove hardware bottlenecks. Algorithmic tuning involves things like adding parallelism, tuning I/O, or choosing more efficient data structures or library routines. Algorithmic tuning generally relies on knowledge of the application’s hotspots and familiarity with the source code, and aims to improve performance for the application in general. Tuning with a profiler can guide all these levels of optimization, but we would caution that a top-down approach is generally advisable, and therefore care should be taken to avoid optimizing at too low a level too soon. In other words, tune your kernels after you are sure that the kernels themselves are the right approaches from a “big picture” perspective.
We include information on accurate timing in this chapter, as it is related to the general topic of gaining insight into the behavior of applications. This information can enable you to collect some information about your application under program control.
Event monitoring registers on the coprocessor
The event monitoring registers on the coprocessor collect data for “activity we can count.” These events will feel familiar to you if you know about event registers on processors. That’s all these really are, but in a device with more cores, more threads, and wider vectors than anything before it. One of the benefits of the Intel Xeon Phi coprocessor is this familiarity and the applicability of so many existing tools.
The events are useful for microarchitectural optimizations and how to identify where optimization work may be most impactful. Microarchitectural tuning relies on knowledge of how the application is executing on the hardware such as how the pipelines, caches, and so forth are being utilized. Tuning at this level can be specific to the architecture and underlying hardware being used. For us to complete microarchitectural tuning, we need access to the real-time performance information gathered by the computing hardware itself while the application runs. This information is stored in a processing core’s Performance Monitoring Unit (PMU), which can be programmed to count occurrences of particular events. Intel® VTune™ Amplifier XE 2013 gives us the ability to both collect and view sampled data from an Intel Xeon Phi coprocessor. This section offers a framework for analyzing the event data collected from an application run on the coprocessor.
We will divide our discussion of the monitoring into two considerations: Efficiency Metrics and Potential Performance Issues.
List of events used in this guide
These events, listed in Table 13.1, can be collected with VTune Amplifier XE 2013 by creating a “Custom Analysis” and then selecting “New Knights Corner Hardware Event-based Sampling Analysis” (we expect this name will be updated to Intel Xeon Phi coprocessor in a future release).
Table 13.1
Intel® Xeon Phi™ Coprocessor Events Used in This Guide
| CPU_CLK_UNHALTED | The number of cycles executed by the core |
| INSTRUCTIONS_EXECUTED | The number of instructions executed by the thread |
| VPU_ELEMENTS_ACTIVE | The number of VPU operations executed by the thread |
| DATA_READ_OR_WRITE | The number of loads and stores seen by a thread’s L1 data cache |
| DATA_READ_MISS_OR_WRITE_MISS | The number of demand loads or stores that miss a thread’s L1 cache |
| L1_DATA_HIT_INFLIGHT_PF1 | The number of demand loads or stores that are for a cacheline already being prefetched from L2 into L1 |
| DATA_READ_OR_WRITE | The number of loads and stores seen by a thread’s L1 data cache. |
| EXEC_STAGE_CYCLES | The number of cycles when the thread was executing computational operations |
| L2_DATA_READ/WRITE_MISS_CACHE_FILL | Counts L2 read or read for ownership misses that were serviced by another core’s L2 cache (on the same card). Includes L2 prefetches that missed the local L2 cache and so is not useful for determining demand cache fills. |
| L2_DATA_READ/WRITE_MISS_MEM_FILL | Counts L2 read or read for ownership misses that were serviced by memory (on the same card). Includes L2 prefetches that missed the local L2 cache, and so is not useful for determining demand memory fills. |
| DATA_PAGE_WALK | The number of L1 TLB misses |
| LONG_DATA_PAGE_WALK | The number of L2 TLB misses |
| VPU_INSTRUCTIONS_EXECUTED | The number of VPU instructions executed by the thread |
| L2_VICTIM_REQ_WITH_DATA | The number of evictions that resulted in a memory write operation |
| HWP_L2MISS | The number of hardware prefetches that missed L2 |
| SNP_HITM_L2 | The number of incoming snoops that hit modified data in L2 (thus resulting in an L2 eviction) |
Efficiency metrics
This section lists some general measures of efficiency that can help in evaluating when to optimize a particular piece of code. The section following this one will focus on a set of metrics that are valuable for application analysis. Along with each metric and its description are a formula for calculating the metric from available events, a threshold for determining when the value for a metric may indicate a performance problem, and some tuning suggestions.
There are several metrics that can be used to measure general efficiency on the Intel Xeon Phi coprocessor. You should look at these metrics first, to get an idea of how well their application is utilizing the resources available. These metrics (except where noted) can also be used to assess the impact of various optimizations as part of an iterative tuning process.
The formulas given for each metric are meant to be calculated at the function level (using the sum of samples from all hardware threads running). The VTune Amplifier XE interface performs this summation automatically if using the “Custom Analysis” Hardware Event-based Sampling analysis type, and the “PMU events” tab with the “Function/Call stack” grouping. The summed values from this interface (per function) can be used to calculate the metrics in this guide.
CPI
CPI – events used
| Event | Meaning |
| CPU_CLK_UNHALTED | The number of cycles executed by the core |
| INSTRUCTIONS_EXECUTED | The number of instructions executed by the thread |
CPI – formulas and thresholds
| Metric | Formula | Investigate If |
| Average CPI per Thread | CPU_CLK_UNHALTED/INSTRUCTIONS_EXECUTED | >4.0, or generally increasing |
| Average CPI per Core | (CPI per Thread)/Number of hardware threads used | >1.0, or generally increasing |
CPI – description and usage
Cycles per instruction, or CPI, is a metric that has been a part of the VTune Amplifier XE interface for many years. It tells the average number of CPU cycles required to retire an instruction, and therefore is an indicator of how much latency in the system affected the running application. Since CPI is a ratio, it will be affected by either changes in the number of CPU cycles that an application takes (the numerator) or changes in the number of instructions executed (the denominator). For that reason, CPI is best used for comparison when only one part of the ratio is changing. For instance, changes might be made to a data structure in one part of the code that lower CPI in a (different) hotspot. “New” and “former” CPI could be compared for that hotspot as long as the code within it hasn’t changed. The goal is to lower CPI, both in hotspots and for the application as a whole.
In order to make full use of the metric, it is important to understand how to interpret CPI when using multiple hardware threads. For analysis of coprocessor performance, CPI can be analyzed in two ways: “per-core” or “per-thread.” Each way of analyzing CPI can be useful. The per-thread analysis is the most straightforward. It is calculated from two events: CPU_CLK_UNHALTED (also known as clock ticks or cycles) and INSTRUCTIONS_EXECUTED. CPU_CLK_UNHALTED counts ticks of the CPU core’s clock. Since the clock is implemented in hardware on the core, all threads on a core would see the same clock. This event is counted at the core level, for a particular sample, all the threads running on the same core will have the same value. The other event used is INSTRUCTIONS_EXECUTED, and this event is counted at the thread level. On a sample, each thread executing on a core could have a different value for this event, depending on how many instructions from each thread have really been retired. Calculating CPI per thread is easy: it is just the result of dividing CPU_CLK_UNHALTED by INSTRUCTIONS_EXECUTED. For any given sample, this calculation will use the core’s value for clock ticks and an individual hardware thread’s value for instructions executed. This calculation is typically done at the function level, using the sum of all samples for each function, and so will calculate an average CPI per hardware thread, averaged across all hardware threads running for the function.
CPI per core is slightly more complex. Again, all threads running on a core share a common value for clock ticks, and they each have individual values for instructions executed. To calculate an “Aggregate” CPI, or Average CPI per core, you divide the core’s CPU_CLK_UNHALTED value by the sum of all the threads’ INSTRUCTIONS_EXECUTED values. For example, assume an application that is using two hardware threads per core on the Intel Xeon Phi coprocessor. One hot function in the application takes 1,200 clock ticks to complete. During those 1,200 cycles, each thread executed 600 instructions. The CPI per thread for this function would be (1200/600) or 2. The CPI per core for this function would be (1200/(600+600)) or 1. Now assume the application was run again using three hardware threads and the same workload. Now each thread retired 400 instructions, for a total of 1,200, in the same amount of time. Now the CPI per thread for the function would be different: (1200/400) or 3 for each thread. The CPI per core would stay the same: (1200/(400+400+400) or 1. Again, the calculation of average CPI per core is typically done at a function level using samples from all cores and threads running. Therefore an easy way to derive average CPI per core is to divide the average CPI per thread value by the number of hardware threads per core used.
The hypothetical example above illustrates how CPI per thread and CPI per core can react in different ways as the result of an application change. In the case above, after adding an additional hardware thread, CPI per thread degraded and CPI per core remained the same. In reality, the third hardware thread allowed the application to complete the same amount of work in the same time. Looking at the data gives a deeper understanding of the situation. CPI per core remained the same, indicating that the core itself was executing instructions at the same rate as before. CPI per thread degraded from 2 to 3 for each thread, revealing that each hardware thread was less efficient than before. Both of these analyses are true—the core performance remained the same running two hardware threads more efficiently or three hardware threads less efficiently. But if you were only looking at CPI per thread, it would appear that performance got worse. In typical usage scenarios on the Intel Xeon Phi coprocessor, it would be possible to make changes that affect CPI per thread and CPI per core differently, and it is important to measure and understand them both.
The Intel Xeon Phi coprocessor supports running up to four hardware threads on each physical core. However, the front-end of the pipeline can only issue up to two instructions per cycle. (This is different than traditional Intel® Xeon® processor pipelines, which currently support two hardware threads and feature front ends that can issue four instructions per cycle.) The availability of four hardware threads on the Intel Xeon Phi coprocessor can be useful for absorbing some of the latency of a workload’s data access. Since the Intel Xeon Phi coprocessor pipeline operates on instructions in-order (meaning instructions must wait for previous ones to have all operands before they can execute), the support for additional hardware threading may be particularly important for some types of applications. While one hardware thread is waiting on data, another can be executing.
Another important thing to know about the front-end of the Intel Xeon Phi coprocessor pipeline is that it does not issue instructions from the same hardware thread for two clock cycles in a row, even if that hardware thread is the only one executing. So, in order to achieve the maximum issue rate, at least two hardware threads must be used. With multiple hardware threads being utilized, the front-end will switch between them in a round-robin fashion. Given these requirements and the ability to issue two instructions per clock, the minimum theoretical CPIs of any application running on Intel Xeon Phi coprocessor can be calculated, and are listed in Table 13.2.
Table 13.2
Minimum Theoretical CPIs
| Number of Hardware Threads / Core | Minimum (Best) Theoretical CPI per Core | Minimum (Best) Theoretical CPI per Thread |
| 1 | 1.0 | 1.0 |
| 2 | 0.5 | 1.0 |
| 3 | 0.5 | 1.5 |
| 4 | 0.5 | 2.0 |
Some applications have enough latency inherent in their data access that all four hardware threads can be utilized, with each adding performance. In this case, the addition of each thread would decrease the per core CPI on the same workload. It can be tricky to look at CPI when increasing or decreasing the amount of work processed, because again these changes affect the instructions executed. A general rule would be that if the amount of work completed were increasing, then in the case where each hardware thread was beneficial then CPI per core would be increasing at a rate less than the increase in work processed. CPI per core is useful in analyzing the benefit of each additional hardware thread. Even when CPI per core is decreasing (good), CPI per thread might be increasing, and this is useful to know as well, because many of the code optimizations we may apply will be addressing CPI at the thread level.
Table 13.3 shows the CPI per core and per thread for a real workload run in our lab as the number of hardware threads/core is scaled from 1 to 4. For this application, the performance of the application was increasing with the addition of each thread, although the addition of the fourth thread did not add as much performance as did the second or third. The data shows that the CPI per thread is increasing as threads are added—meaning each is becoming less efficient—but the CPI per core is decreasing overall, as expected since each thread adds performance. For this workload, the number of instructions executed was roughly constant across all the hardware thread configurations, so the CPI directly affected execution time. When CPI per core decreased, that translated to a reduction in total execution time for the application.
Table 13.3
CPI Example

CPI – tuning suggestions
Any changes to an application will affect CPI, since it is likely that either the number of instructions executed or the time taken to complete them will change. The goal in general should be to reduce CPI per core (and therefore execution time), especially when compared to previous versions of the application. Most of the performance suggestions in each of the issues discussed later in the section “Potential Performance Issues” can be used to try to reduce CPI. Keep in mind that some beneficial optimizations, such as ones undertaken to increase Vectorization Intensity may actually increase CPI because the amount of work done with a single instruction increases, and thus the number of instructions executed overall can decrease. CPI is most useful as a general comparison and efficiency metric rather than as a sole determinant of performance.
Compute to data access ratio
Compute to data access ratio – events used
| Event | Meaning |
| VPU_ELEMENTS_ACTIVE | The number of VPU1 operations executed by the thread |
| DATA_READ_OR_WRITE | The number of loads and stores seen by a thread’s L1 data cache |
| DATA_READ_MISS_OR_WRITE_MISS | The number of demand loads or stores that miss a thread’s L1 cache |
| L1_DATA_HIT_INFLIGHT_PF1 | The number of demand loads or stores that are for a cache line already being prefetched from L2 into L1 |
1Vector processing unit, the part of the coprocessor that performs vector arithmetic.
Compute to data access ratio – formulas and thresholds
| Metric | Formula | Investigate If |
| L1 Compute to Data Access Ratio | VPU_ELEMENTS_ACTIVE / DATA_READ_OR_WRITE | < Vectorization Intensity |
| L2 Compute to Data Access Ratio | VPU_ELEMENTS_ACTIVE/ DATA_READ_MISS_OR_WRITE_MISS | < 100x L1 Compute to Data Access Ratio |
Compute to data access ratio – description and usage
These metrics are a way to measure the computational density of an application, or how many computations it is performing on average for each piece of data loaded. The first, L1 Compute to Data Access Ratio, should be used to judge suitability of an application for running on the coprocessor. Applications that will perform well on the coprocessor should be vectorized, and ideally be able to perform multiple operations on the same pieces of data (or same cache lines). The L1 ratio calculates an average of the number of vectorized operations that occur for each L1 cache access. All vectorized operations, including data operations, are included in the numerator by definition of the VPU_ELEMENTS_ACTIVE event. VPU_ELEMENTS_ACTIVE was used instead of VPU_INSTRUCTIONS_EXECUTED because it gives a more accurate picture of how many operations occurred. For example, an instruction applied to a register packed with 16 floats will count as 16 operations. All demand loads and stores are included in the denominator, and no prefetches.
The threshold for the L1 metric is a guideline. Most codes that run well on the coprocessor should be able to achieve a ratio of computation to L1 access that is greater than or equal to their Vectorization Intensity. This is similar to a 1:1 ratio, one data access for one computation, except that by vectorizing each computation should be operating on multiple elements at once. An application that cannot achieve a ratio above this threshold may not be computationally dense enough to fully utilize the capabilities of the coprocessor.
Computational density at the L1 level is critical. At the L2 level, it is an indicator of whether code is operating efficiently. Again, the threshold given is a guideline. For best performance, data should be accessed from L1. This doesn’t mean that data cannot be streamed from memory—the high aggregate bandwidth on Intel Xeon Phi coprocessors is advantageous for this. But, ideally, data should be streamed from memory into the caches using prefetches, and then should be available in L1 when the demand load occurs. This is even more important for the Intel Xeon Phi coprocessor than for traditional processors. Long data latency mitigates the performance benefits of vectorization, which is one of the cornerstones of coprocessor performance. The L2 Compute to Data Access Ratio shows the average number of L2 accesses that occurred for each vectorized operation. Applications that are able to block data for the L1 cache, or reduce data access in general, will have higher numbers for this ratio. As a baseline, the threshold of 100x the L1 ratio has been used, meaning there should be roughly 1 L2 data access for every 100 L1 data accesses. Like the L1 metric, it includes all vectorized operations (including data movement) in the numerator.
The denominator for the L1 metric includes all demand1 loads and stores. The denominator for the L2 metric is slightly more complicated—it uses all the demanded data accesses that missed L1—only these will be requested from L2. It will be strongly related to the L1 Hit Rate discussed in later in this chapter.
Compute to data access ratio – tuning suggestions
For the L1 computational density metric, if the value is less than the Vectorization Intensity, general tunings to reduce data access should be applied. This is best accomplished by aiming to reduce the number of instructions on the critical path in general. Remove conditionals, initialization, or anything not needed in inner loops. Streamline data structures. Align data and ensure the compiler is assuming alignment in generating loads and stores. Ensure the compiler is generating good vectorized code. For example, ensure that the compiler is not register spilling. Eliminate task or thread management overhead as much as possible.
For the L2 computational density metric, try to improve data locality for the L1 cache using techniques described in later in this chapter. Restructuring code using techniques or pragmas from Intel® Cilk™ Plus can also enable the compiler to generate more efficient vectorized code, and can help improve both the L1 and L2 metrics.
Potential performance issues
This section highlights several possible performance issues that can be detected using events. For each issue, the events needed are listed along with their descriptions. Each issue is identified using metrics and thresholds. Like the metrics given in prior section, the formulas given for the metrics below are meant to be calculated at the function level (using the sum of samples from all hardware threads running). The Intel VTune Amplifier XE interface performs this summation automatically if using the “Custom Analysis” Hardware Event-based Sampling analysis type, and the “PMU events” tab with the “Function/Call stack” grouping. The summed values from this interface (per function) can be used to calculate the metrics in this guide.
The value computed for each metric should then be compared to the threshold value. The thresholds given in this document are generally chosen conservatively. This means that an application is more likely to trigger the threshold criteria without having a problem than to have one of the given issues without triggering the threshold. The thresholds only indicate that you may want to investigate further. All of the metrics in this section are also designed to be used after the execution environment is fixed (will be held constant during tuning analysis work). Changes to the number of hardware threads or cores used may affect the predictability of the metrics.
General cache usage
General cache usage – events used
| Event | Meaning |
| CPU_CLK_UNHALTED | The number of cycles in which the core was executing |
| DATA_READ_MISS_OR_WRITE_MISS | The number of demand loads or stores that missed the L1 data cache |
| L1_DATA_HIT_INFLIGHT_PF1 | The number of demand loads or stores that are for a cacheline already being prefetched from L2 into L1 |
| DATA_READ_OR_WRITE | The number of loads and stores seen by a thread’s L1 data cache |
| EXEC_STAGE_CYCLES | The number of cycles when the thread was executing computational operations |
| L2_DATA_READ/WRITE_MISS_CACHE_FILL | Counts L2 read or read for ownership misses that were serviced by another core’s L2 cache (on the same card). Includes L2 prefetches that missed the local L2 cache and so is not useful for determining demand cache fills. |
| L2_DATA_READ/WRITE_MISS_MEM_FILL | Counts L2 read or read for ownership misses that were serviced by memory (on the same card). Includes L2 prefetches that missed the local L2 cache, and so is not useful for determining demand memory fills. |
General cache usage – formulas and thresholds
| Metric | Formula | Investigate If |
| L1 Misses | DATA_READ_MISS_OR_WRITE_MISS + L1_DATA_HIT_INFLIGHT_PF1 | <95% |
| L1 Hit Rate | (DATA_READ_OR_WRITE – L1 Misses) / DATA_READ_OR_WRITE | <90% |
| Estimated Latency Impact | (CPU_CLK_UNHALTED – EXEC_STAGE_CYCLES – DATA_READ_OR_WRITE) / DATA_READ_OR_WRITE_MISS | >145 |
General cache usage – description and usage
For applications running on the Intel Xeon Phi coprocessor, good data locality is critical for achieving their performance potential. In order to realize the benefit from vectorizing applications, the data must be accessible to be packed into VPU registers at as low a latency as possible. Otherwise, the time to pack the registers dominates the time to do the computation. Although being able to switch execution among four hardware threads does hide some data access latency, it can still have a significant impact on performance. Therefore, improving data locality is one of the most worthwhile optimization efforts for the Intel Xeon Phi coprocessor. Both L1 and L2 locality are important. Program changes that result in data being accessed from local L2 cache as opposed to a remote cache or memory save at least 250 cycles of access time. Under load, the savings are even greater. Accessing data from L1 as opposed to L2 saves about 20 cycles.
Traditionally, Hit Rate metrics indicate how well each level of cache is being used. It is normally calculated by dividing the number of hits by the total number of accesses for that level of cache. Hit rates also typically only apply to “demand” accesses, meaning true loads from the application as opposed to software or hardware prefetches. It is possible to determine the demand hit rate for the Data (or L1) cache, but the formula requires some explanation. Data cache accesses can be either a standard hit, a miss, or a hit to an in-flight prefetch, which is counted separately. Hits to an in-flight prefetch occur when the data was not found in the cache, and was a match for a cache line already being retrieved for the same cache level by a prefetch. These types of hits have a longer latency than a standard hit, but less than a miss. To be conservative with the hit rate, in this chapter they are treated like misses and thus subtracted in the numerator.
Unfortunately, the L2 and FILL events on the Intel Xeon Phi coprocessor are counting demand loads and stores as well as multiple types of prefetches. Not all of the prefetches are accurately counted by other events, so the formulas can’t be adjusted to calculate real demand L2 hits or misses. This chapter does not recommend any metrics that depend on the L2 or FILL events, except for memory bandwidth (where including prefetches is okay). The Estimated Latency Impact metric is given in an attempt to work around the lack of L2 metrics. This metric is a rough approximation of the clock cycles devoted to each L1 cache miss. The numerator is computed by using the total CPU cycles and subtracting one for each L1 cache hit (because each L1 access should take one cycle), and one for each cycle that the EXEC_STAGE_CYCLES event is active. EXEC_STAGE_CYCLES should be active for many computations and is used to partially filter out computation cycles. What’s left are considered to be cycles devoted to data access beyond the L1 cache. The denominator is L1 cache misses, giving an estimate of the number of CPU cycles spent on each L1 cache miss. It should be stressed that this is only an approximation and is not fully accurate for many reasons, including pipeline effects, un-accounted-for cycles, and overlapping memory accesses.
The Estimated Latency Impact metric can give an indication of whether the majority of L1 data misses are hitting in L2. Given that the L2 data access latency is 21 cycles, Estimated Latency Impacts that approach that number are having a high degree of L2 hits. The threshold is set at 145, as it is the average of the unloaded L2 and memory access times. The other important thing to note about the Estimated Latency Impact is that, like all ratios, it is affected by either changes in the numerator or denominator. In most cases, an optimization that positively affects data access should result in a decrease in this metric’s value. However, some changes that are positive, such as a decrease in L1 misses, may result in a value for this metric that is unchanged, because it would reduce both the numerator and the denominator. This type of change would affect the L1 Hit Rate Metric instead.
Although not used in any of the metrics, the L2_DATA_READ/WRITE_MISS_CACHE_FILL and L2_DATA_READ/WRITE_MISS_MEM_FILL events can also be helpful for tuning data locality. As mentioned in the descriptions for these events, they cannot be used to compute any L2-related metrics because they include some prefetching. The quantities for these events should not be considered accurate, but the general ratio of CACHE_FILLs to MEM_FILLs may indicate that too much data was being accessed from other core’s caches. Since remote cache accesses have high latency for memory accesses, they should be avoided if possible.
General cache usage – tuning suggestions
Many traditional techniques for increasing data locality apply to the Intel Xeon Phi coprocessor: cache blocking, software prefetching, data alignment, and using streaming stores can all help keep more data in cache. For issues with data residing in neighboring caches, using cache-aware data decomposition or private variables can help. Set associativity issues are another type of data locality issue that can be difficult to detect. If hit rates are low in spite of trying some of the above techniques to reduce them, conflict misses occurring from too many cachelines mapping to the same set may be the culprit. Set associativity issues (conflict misses) can occur on the Intel Xeon Phi coprocessor when an application is accessing data in L1 with a 4-KB stride or data in L2 with a 64-KB stride. Unfortunately, the specific type of miss caused by set associativity issues (conflict misses) cannot be separated from general misses detected by events. If set associativity issues are suspected, try padding data structures (while maintaining alignment) or changing the access stride.
TLB misses
TLB misses – events used
| Event | Meaning |
| DATA_PAGE_WALK | The number of L1 TLB misses |
| LONG_DATA_PAGE_WALK | The number of L2 TLB misses |
| DATA_READ_OR_WRITE | The number of read or write operations |
TLB misses – formulas and thresholds
| Metric | Formula | Investigate If |
| L1 TLB miss ratio | DATA_PAGE_WALK/DATA_READ_OR_WRITE | >1% |
| L2 TLB miss ratio | LONG_DATA_PAGE_WALK/ DATA_READ_OR_WRITE | >0.1% |
| L1 TLB misses per L2 TLB miss | DATA_PAGE_WALK/ LONG_DATA_PAGE_WALK | Near 1 |
TLB misses – description and usage
The Intel Xeon Phi coprocessor has a two-level TLB2 and at least two page sizes (4 KB and 2 MB). By default, the operating system sets up programs to use 4-KB pages. In this case, the L2 TLB acts as a page table cache and reduces the L1 TLB miss penalty (for an L2 TLB hit) to around 25 clock cycles. For large (2-MB) pages, the L2 TLB acts as a standard TLB, and the L1 miss penalty (for an L2 TLB hit) is only around 8 cycles.
The L2 TLB miss penalty is at least 100 clocks; it is impossible to hide this latency with prefetches, so it is important to try to avoid L2 TLB misses. L1 TLB misses that hit in the L2 TLB are of less concern.
Since there are 64 cache lines in a 4-KB page, the L1 TLB miss ratio for sequential access to all the cache lines in a page is 1/64. Thus any significant L1 TLB miss ratio indicates lack of spatial locality; the program is not using all the data in the page. It may also indicate thrashing; if multiple pages are accessed in the same loop, the TLB associativity or capacity may not be sufficient to hold all the TLB entries. Similar comments apply to large pages and to the L2 TLB.
If the L1 to L2 TLB miss ratio is high, then there are many more L1 TLB misses then there are L2 TLB misses. This means that the L2 TLB has the capacity to hold the program’s working set, and the program may benefit from large pages.
TLB misses – tuning suggestions
For loops with multiple streams, it may be beneficial to split them into multiple loops to reduce TLB pressure (this may also help cache locality). When the addresses accessed in a loop differ by multiples of large powers of two, the effective size of the TLBs will be reduced because of associativity conflicts. Consider padding between arrays by one 4-KB page.
If the L1 to L2 ratio is high then consider using large pages.
In general, any program transformation that improves spatial locality will benefit both cache utilization and TLB utilization. The TLB is just another kind of cache.
VPU usage
VPU usage – events used
| Event | Meaning |
| VPU_INSTRUCTIONS_EXECUTED | The number of VPU instructions executed by the thread |
| VPU_ELEMENTS_ACTIVE | The number of vector elements active for a VPU instruction |
VPU usage – formula and threshold
| Metric | Formula | Investigate If |
| Vectorization Intensity | VPU_ELEMENTS_ACTIVE / VPU_INSTRUCTIONS_EXECUTED | <8 (DP), <16(SP) |
Vectorization intensity cannot exceed 8 for double-precision code and 16 for single-precision code. Small values probably indicated poor vectorization; for example, lots of scalar operations or lots of gathers and scatters. The compiler vectorization report should be examined.
VPU usage – description and usage
We would like to be able to measure efficiency in terms of floating-point operations per second, as that can easily be compared to the peak floating-point performance of the machine. However, the Intel Xeon Phi coprocessor does not have events to count floating-point operations. An alternative is to measure the number of vector instructions executed.
Vector instructions include instructions that perform floating-point operations, instructions that load vector registers from memory and store them to memory, instructions to manipulate vector mask registers, and other special purpose instructions such as vector shuffle.
Vector operations that operate on full vectors use the hardware’s “all-ones” mask register %k0. Thus when a vector operation on two full vectors is performed, the VPU_ELEMENTS_ACTIVE event is incremented by 16 (for single precision) or 8 (for double precision). Scalar FP operations are generally implemented by the compiler using the vector registers, but with a mask indicating that they apply to only one vector element.
So a reasonable rule of thumb to see how well a loop is vectorized is to add up the values of VPU_ELEMENTS_ACTIVE and VPU_INSTRUCTIONS_EXECUTED for every assembly instruction in the loop and take the ratio. If this number approaches 8 or 16 then there’s a good chance that the loop is well vectorized. If the number is much smaller, then the loop was not well vectorized.
This method should be used in conjunction with the compiler’s vectorization report to get a more complete understanding.
Care should be taken when attempting to apply this method to larger pieces of code. Various vagaries in code generation and the fact that mask manipulation instructions count as vector instructions can skew the ratio and lead to incorrect conclusions.
VPU usage – tuning suggestions
Low vectorization intensity may indicate that the compiler failed to vectorize a particular loop, or that the vectorization was inefficient. Examination of the vectorization report may provide insight into the problems. Problems are typically one or more of:
1. Unknown data dependences. #pragma simd and #pragma ivdep can be used to tell the compiler to ignore unknown dependences or to tell it that dependences are of a certain type, such as a reduction.
2. Non–unit-stride accesses. These can be due to indexing in multidimensional arrays, or due to accessing fields in arrays of structures. Loop interchange and data structure transformations can eliminate some of these.
3. True indirection (indexing an array with a subscript that is also an array element). These are typically algorithmic in nature and may require major data structure reorganization to eliminate.
Memory bandwidth
Memory bandwidth – events used
| Event | Meaning |
| L2_DATA_READ_MISS_MEM_FILL | The number of read operations that resulted in a memory read (includes prefetches). |
| L2_DATA_WRITE_MISS_MEM_FILL | The number of write operations that resulted in a memory read. Writes are implemented using a memory Read for Ownership (RFO) transaction to maintain coherency. Includes prefetches. |
| L2_VICTIM_REQ_WITH_DATA | The number of evictions that resulted in a memory write operation |
| HWP_L2MISS | The number of hardware prefetches that missed L2 |
| SNP_HITM_L2 | The number of incoming snoops that hit modified data in L2 (thus resulting in an L2 eviction) |
| CPU_CLK_UNHALTED | The number of cycles |
Memory bandwidth – formulas and threshold
| Metric | Formula | Investigate If |
| Read bandwidth (bytes/clock) | (L2_DATA_READ_MISS_MEM_FILL + L2_DATA_MISS_MEM_FILL +HWP_L2MISS) * 64 / CPU_CLK_UNHALTED | |
| Write bandwidth (bytes/clock) | (L2_VICTIM_REQ_WITH_DATA + SNP_HITM_L2) * 64 / CPU_CLK_UNHALTED | |
| Bandwidth (GB/Sec) | (Read bandwidth + Write bandwidth) × frequency (in GHz) | <80 GB/Sec |
Memory bandwidth – description and usage
This formula computes bandwidth by summing up the data transfers from all the different types of events that cause memory reads or writes. It does not take into account streaming stores. For an application using streaming stores, bandwidth will be underestimated.
When the core executes an instruction that reads memory, it must fill both the L2 and the L1 cache with the data. If the data is in neither cache, the core will read the data from either another core’s cache or from memory. The latter case results in an L2_DATA_READ_MISS_MEM_FILL event. When the core executes an instruction that writes memory, it must first execute a Read for Ownership (RFO) to bring the data into the cache hierarchy. If that data is fulfilled from memory the write operation results in an L2_DATA_WRITE_MISS_MEM_FILL event. As noted previously, the FILL events include some types of prefetches. Although this makes them inappropriate for use in calculating Hit Rates, which assume demand data only, they can still be used in bandwidth calculations, as a prefetch does use real bandwidth.
When an L2 entry is required to hold a datum and there are no available lines, the core must evict a line; if that line has been modified then it must be written to memory. This results in an L2_VICTIM_REQ_WITH_DATA event. If data has been modified in one core’s cache and another core needs that data, the first core receives a snoop Hit Modified (HITM) event which causes it to evict that data. This results in an SNP_HITM_L2 event. Normally the snoop would result in a cache-to-cache transfer to the second core but if the core is using the clevict3 instructions then they appear as incoming snoops even though they were generated by the same core. It is usually safe to ignore this event but there are some cases in which the compiler or runtime will use clevict instructions. If there is a lot of modified data shared between two cores, including this event can result in overestimation of memory bandwidth (by including cache-to-cache transfers).
This method of calculating bandwidth uses core events. An alternate method exists which collects samples from uncore events found on the memory controllers. The VTune Amplifier XE “Bandwidth” profile uses the uncore sampling method. Both methods should result in approximately the same values for memory bandwidth in most cases.
Memory bandwidth – tuning suggestions
The user must know how much memory bandwidth their application should be using. If data sets fit entirely in a core’s L2 cache, then the memory bandwidth numbers will be small. If the application is expected to use a lot of memory bandwidth (for example by streaming through long vectors) then this method provides a way to estimate how much of the theoretical bandwidth is achieved.
In practice achieved bandwidth of >140 GB/sec is near the maximum that an application is likely to see. If the achieved bandwidth is substantially less than this it is probably due to poor spatial locality in the caches, possibly because of set associativity conflicts, or because of insufficient prefetching. In the extreme case (random access to memory), many TLB misses will be observed as well.
Intel® VTune™ Amplifier XE product
The most widely used tool for collecting and analyzing the event monitoring registers on the coprocessor is the Intel VTune Amplifier XE. The current process for using VTune Amplifier XE to collect and view data from an Intel Xeon Phi coprocessor is detailed in several documents listed in the “For More Information” section at the end of this chapter. If you do not yet use VTune, you should consider learning it from one the fine documents or tutorials online.
Data may need to be collected over multiple runs, and metrics will need to be calculated outside of VTune Amplifier XE. Support within VTune Amplifier XE for the Intel Xeon Phi coprocessor will certainly continue to evolve and improve.
Although looking at the individual counts of various events can be useful, in this document most events will be used within the context of metrics covered in earlier sections. The general method to follow for performance analysis with VTune is:
1. Select a hotspot (a function with a large percentage of the application’s total computational cycles).
2. Evaluate the efficiency of that hotspot using the metrics in prior section titled “Efficiency Metrics.”
3. If inefficient, check each applicable metric in the prior section titles “Potential Performance Issues.” If a value of a metric is below the suggested threshold, or unacceptable by other standards, use the additional information in this guide to find and fix the problem.
4. Repeat until all significant hotspots have been evaluated.
When following this method, it is important to carefully select a representative workload. Many of the metrics involve collecting several events, and this may require running the workload multiple times to collect data. An ideal workload should have some steady state phase(s), where behavior is constant for a duration longer than the data collection interval. The workload should also give consistent, repeatable results, and be the only application consuming a significant portion of computational time during data collection. If the workload is being run multiple times to collect data, ensure that there are no warm-cache effects or other factors that affect performance. Finally, before beginning analysis, a sanity check with basic coprocessor and instruction events is encouraged—ensure the event counts are constant run-to-run and fall within expectations.
Avoid simple profiling
Instrumenting for profiling using the –pg option will generally diminish or stop optimizations, thereby reduce performance from what the real “release” build would create. Better profiling can be done using the less intrusive Intel VTune Amplifier XE because the “release” build should be used with VTune Amplifier.
Performance application programming interface
Another way to use the event monitoring registers on the coprocessor is through the Performance Application Programming Interface (PAPI) and tools that use PAPI. The Intel® Trace Analyzer and Collector supports PAPI as well. The PAPI API is a popular project to access hardware counters in a consistent manner to allow use of the performance counter hardware found in most major microprocessors including the Intel Xeon Phi coprocessor. There are pointers to more information in the “For More Information” at the end of this chapter.
MPI analysis: Intel Trace Analyzer and Collector
In order to help you analyze the performance of an MPI-based application, the Intel Trace Collector gathers information from running programs into a trace file, and the Intel Trace Analyzer allows the collected data to be viewed and analyzed after a run. The Intel Trace Analyzer and Collector support processors and coprocessors. The Trace Collector can integrate information from multiple sources including an instrumented Intel® MPI Library and PAPI. If you do not yet use the Intel Trace Analyzer and Collector, you should consider learning it.
The support for the Intel Xeon Phi coprocessor is a straightforward extension of the processor support that takes into consideration the existence of coprocessors in a system.
Because trace files need to be collected to disk, the tool assumes that you have set up NFS properly on the host processors and the coprocessors (documentation is online, see “For More Information” at the end of this chapter). It is important to save the traces to an NFS mounted drive to avoid competing with the application for limited memory.
Be sure to set the environment variable VT_TIMER to CPU_Norm is needed get correct traces from the applications running on the coprocessor alone. The release notes and documentation will have up-to-date changes as needed and more information on available timers.
Generating a trace file: coprocessor only application
To generate a trace file from an MPI application running on a coprocessor, you need to use the MPI libraries, Trace Collector libraries, and a compiler that can generate an executable file compatible with the targeted coprocessor. Do the following steps to complete these tasks:
1. Source mpivars.sh and itacvars.sh from the mic/bin directories.
2. Compile the application using the statically linked Intel Trace Collector libraries:
host$ mpiicc -mmic -trace myApp.c -o myApp_mic
3. Run this binary with -wdir option. Ideally, save the trace files to an NFS mounted file system:
host$ mpiexec.hydra -host host1-mic0 -wdir /mnt/nfs/traces -n 4 myApp_mic
4. If everything is correct, you get a message that a trace file has been written into the /mnt/nfs/traces directory.
Generating a trace file: processor+coprocessor application
To generate a trace file from an application running on the host system and coprocessor simultaneously, compile one part for the host system and another part for the coprocessor:
1. Set the compiler, MPI, and Intel Trace Analyzer and Collector variables for the Intel® MIC Architecture.
2. Source itacvars.sh from the <itac_installdir>/mic/bin directory and compile the application:
host$ mpiicc -mmic -trace myApp.c -o myApp_mic
3. Set the MPI and Intel Trace Analyzer and Collector variables for the host system.
4. Source itacvars.sh from the <itac_installdir>/intel64/bin directory and compile the same application for the host:
host$ mpiicc -trace myApp.c -o myApp_host
5. Run the application:
host$ mpiexec.hydra -wdir /mnt/nfs/traces -genv I_MPI_FABRICS shm:tcp -host localhost -n 4 myApp_host : -host host1-mic0 -env LD_LIBRARY_PATH $MPI_ROOT/mic/lib -n 16 myApp_mic
To generate a trace file from an application not linked with Trace Collector library you need to do the following:
1. Source mpivars.sh and itacvars.sh from the intel64/bin directories.
2. Make sure that libelf.so, libdwarf.so, and libvtunwind.so are available either through LD_LIBRARY_PATH environment variable or in a system library directory.
3. Run the application:
host$ mpiexec.hydra -trace -wdir /mnt/nfs/traces -genv I_MPI_FABRICS shm:tcp -host localhost -n 4 myApp_host : -host host1-mic0 -env LD_LIBRARY_PATH $MPI_ROOT/mic/lib:$VT_ROOT/mic/slib -n 16 myApp_mic
4. The trace file will be generated on the host in the /mnt/nfs/traces directory.
Timing
The Intel Xeon Phi coprocessor inherits from the Intel Xeon processor family a well-established architecture and programming concepts that allow us to re-use highly parallel applications. Unlike the Intel Xeon server family, timer hardware devices including the programmable interval timer (PIT), the CMOS real time clock (RTC), the advanced configuration and power interface (ACPI) timer, and the high precision event timer (HPET) are absent on the coprocessor.
Clocksources on the coprocessor
There are two clock generators that can generate clock signals. At the system level is the PCIe clock generator; the second is the ICC PLL. From the programmers point of view there are two clock sources accessible on the coprocessor: MIC Elapsed Time Counter (micetc) and the Time Stamp Counter (tsc).
MIC elapsed time counter (micetc)
The default clock source on the coprocessor has been micetc. There is now a mechanism to use TSC as the clocksource, we may post additional information on http://lotsofcores.com on this topic. This counter is located in the System BOX (SBOX); therefore there is just one per coprocessor. The frequency of this clock is spread within a 0.5 percent following a 30-KHz triangular profile to reduce EMC emissions as shown in Figure 13.1. An additional mechanism is implemented on software to compensate for this spread.
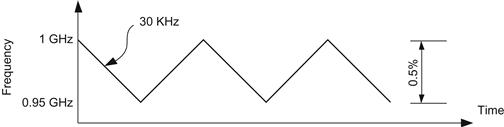
Figure 13.1 Spread-Spectrum Frequency for ETC.
The micetc clocksource is also compensated for power management events delivering a very stable clocksource.
Time stamp counter (tsc)
Each core has a 64-bit counter that monotonically increments the time-stamp counter every clock cycle and reset to 0 whenever the processor is reset. Having multiple counters in the coprocessor increases the complexity to synchronize all of them when time measurements are required on different cores.
The Read Time-Stamp Counter instruction RDTSC allows to load the content of the core’s time-stamp counter into the EDX:EAX registers.
The slow-down factor can be calculated by the area under the frequency curve. Since the spread-spectrum profile is triangular, the effective area is simply half of the height, more specifically ½ × 0.5 %=0.25 %. In addition, although this clocksource is low overhead, it is greatly affected by changes in power management therefore it is not possible to assure that the timestamp on multiple cores will be synchronized. When a thermal event occurs, a change in the frequency is performed to allow cooling, but this marks the clock as unstable hence it is deleted from available_clocksource and current_clocksource is switched to micetc.
For this reason the tsc clocksource is limited to cases where it is required to time very tight loops or just counting cycles will suffice.
Setting the clocksource
Setting the clocksource can be done with the following procedure. First, ssh into the Xeon Phi card as root:
1. Verify your current clocksource with:
cat /sys/devices/system/clocksource/clocksource0/current_clocksource
2. Verify the available clocksources with:
cat /sys/devices/system/clocksource/clocksource0/available_clocksource
3. Change to tsc with:
echo tsc > /sys/devices/system/clocksource/clocksource0/current_clocksource
Time structures
C programmers have had access to functions to get a point in time for time now. These libraries have been progressing with ever increasing precision, from seconds to nanoseconds. Each change in precision comes with a new interface and structural representation.
The first function to measure time is time and uses the following structure:
time_t time (time_t*);
time_t is used to time in seconds. A function that returns the time duration between two points in time
double difftime(time_t t1, time_t t2);
Increasing in precision is the function ftime, now marked as legacy.
struct timeb
{
time_t time; // seconds
unsigned short millitm; // milliseconds
};
int ftime(struct timeb *tp);
The following two functions are widely in used today: gettimeofday and clock_gettime.
struct timeval
{
time_t tv_sec; // seconds
int_least20_t tv_usec; // microseconds
};
int gettimeofday(struct timeval *tv, struct timezone *tz);
struct timespec
{
time_t tv_sec; // seconds
long tv_nsec; // nanoseconds
};
int clock_gettime(clockid_t clk_id, struct timespec *tp);
clk_id identifies a particular clock. A clock may be system-wide (micetc) and thus visible to all processes, or per-process (tsc) if it measures time only within a single process. The values supported are (man clock_gettime):
| CLOCK_REALTIME | System-wide real-time clock. Setting this clock requires appropriate privileges. |
| CLOCK_MONOTONIC | Clock that cannot be set and represents monotonic time since some unspecified starting point. |
| CLOCK_PROCESS_CPUTIME_ID | High-resolution per-process timer from the CPU. |
| CLOCK_THREAD_CPUTIME_ID | Thread-specific CPU-time clock. |
| CLOCK_REALTIME_HR | High-resolution version of CLOCK_REALTIME |
| CLOCK_MONOTONIC_HR | High-resolution version of CLOCK_MONOTONIC |
Time penalty
When measuring code sections using gettimeofday or clock_gettime there is a time penalty that needs to be taken into consideration. A series of experiments were run on a preproduction Intel Xeon Phi coprocessor with a frequency of 1.2 GHz and can be summarized in Table 13.4.
Table 13.4
Time Penalty Incurred by the Clocksources micetc and tsc (Nanoseconds) When Called from a Single Thread

The average penalty of using micetc for clock_gettime is 1550.46 nanoseconds and 1612.81 nanoseconds for gettimeofday. In the case of tsc clock_gettime is 200.25 nanoseconds and 291.44 nanoseconds for gettimeofday. Both cases when called from a single thread. There is a difference between clock_gettime and gettimeofday of ~62 nanoseconds (4.02 percent) when the clocksource is micetc and ~91 nanoseconds (45.53 percent) for tsc. The penalty of using tsc to micetc is 1:7.74 for clock_gettime and 1:5.53 for gettimeofday.
Measuring timing and data in offload regions
You can measure both the amount of time it takes to execute an offload region of code, as well as the amount of data transferred during the execution of the offload region. This is described in Chapter 7 in a section titled “Measuring Timing and Data in Offload Regions.”
Summary
Profiling a program is a critical element in gaining accurate insights into how a program is running, and therefore in how to tune an application. It is important to use a top-down approach to optimization to avoid optimizing a small portion of a code embodied in a nonoptimal high-level approach. Some profiling tools can give insight based on event counters built into the coprocessor. Other profiling tools specialize in analysis of communication traffic when using MPI. Both can yield critical insights that may lead to breakthroughs in performance of an application.
The coprocessor has two clocksources available; micetc incurs a higher time penalty in exchange of system-wide clock with a stable measurement in presence of power management events. The use of the tsc clocksource is useful for needs where timing of tight loops is required or just the counting of cycles is enough.
For more information
• Compiler Methodology (including performance optimization) for Intel Many Integrated Core architecture, http://software.intel.com/en-us/articles/programming-and-compiling-for-intel-many-integrated-core-architecture
• How To: NFS Mounting with Intel Many Integrated Core Architecture, http://intel.com/software/mic
• Intel VTune Amplifier XE 2013 Evaluation Center, http://software.intel.com/en-us/intel-vtune-amplifier-xe-2013-evaluation-options/
• Intel VTune Amplifier XE 2013 Product Page, http://software.intel.com/en-us/intel-vtune-amplifier-xe/
• Intel Xeon Phi coprocessor developer portal, http://intel.com/software/mic-developer
• Intel Xeon Phi Coprocessor Performance Monitoring Units documentation, separately or as part of the Software Developers Guide, http://intel.com/software/mic
• “Optimization and Performance Tuning for Intel® Xeon Phi™ Coprocessors, Part 2: Understanding and Using Hardware Events,” http://software.intel.com/en-us/articles/optimization-and-performance-tuning-for-intel-xeon-phi-coprocessors-part-2-understanding
• PAPI Web site, http://icl.cs.utk.edu/papi/index.html
• Trace Analyzer and Collector for Linux OS Documentation, http://software.intel.com/en-us/intel-trace-analyzer/
• Updates on topics from this or other chapters, see http://lotsofcores.com/errata/
1Demand loads and store counts do not include software or hardware prefetches in their counts.
2Translation look-aside buffer, hardware for accelerating translation of virtual addresses to physical addresses by caching translations in a buffer.
3CLEVICT0 and CLEVICT1 instructions cause eviction of L1 or L2 cache lines, respectively. Full documentation of these instructions can be found in the Intel® Xeon Phi™ Coprocessor Instruction Set Architecture Reference Manual, http://intel.com/software/mic.