
Proactive Cyber Defense
Richard Colbaugh and Kristin Glass, Sandia National Laboratories, Albuquerque, New Mexico, USA
Chapter Outline
2.2.2 Algorithm 1: Transfer Learning
2.2.3 Algorithm 2: Synthetic Attack Generation
2.3.3 Case Study: Politically Motivated DDoS
2.1 Introduction
Rapidly advancing technologies and evolving operational practices and requirements increasingly drive both private and public sector enterprises toward highly interconnected and technologically convergent information networks. Proprietary information processing solutions and stove-piped databases are giving way to unified, integrated systems, thereby dramatically increasing the potential impact of even a single well-planned network intrusion, data theft, or denial-of-service (DoS) attack. It is therefore essential that commercial and government organizations develop network defenses that are able to respond rapidly to, or even foresee, new attack strategies and tactics.
Recognizing these trends and challenges, some cyber security researchers and practitioners are focusing their efforts on developing proactive methods of cyber defense, in which future attack strategies are anticipated and these insights are incorporated into defense designs [1–5]. However, despite this attention, much remains to be done to place the objective of proactive defense on a rigorous and quantitative foundation. Fundamental issues associated with the dynamics and predictability of the coevolutionary “arms race” between attackers and defenders are yet to be resolved. For instance, although recent work has demonstrated that previous attacker actions and defender responses provide predictive information about future attacker behavior [3–5], not much is known about which measurables have predictive power or how to exploit these to form useful predictions. Moreover, even if these predictability and prediction issues were resolved, it is still an open question how to incorporate such predictive analytics into the design of practically useful cyber defense systems.
This chapter considers the problem of protecting enterprise-scale computer networks against intrusions and other disruptions. We begin by leveraging the coevolutionary relationship between attackers and defenders to develop two proactive filter-based methods for network defense. Each of these methods formulates the filtering task as one of behavior classification, in which innocent and malicious network activities are to be distinguished, and each assumes that only very limited prior information is available regarding exemplar attacks or attack attributes. The first method models the data as a bipartite graph of instances of network activities and the features or attributes that characterize these instances. The bipartite graph data model is used to derive a machine learning algorithm that accurately classifies a given instance as either innocent or malicious based upon its behavioral features. The algorithm enables information concerning previous attacks to be “transferred” for use against novel attacks; crucially, it is assumed that previous attacks are drawn from a distribution of attack instances related but not identical to that associated with the new malicious behaviors. This transfer learning algorithm offers a simple, effective way to extrapolate attacker behavior into the future, and thus significantly increases the speed with which defense systems can successfully respond to new attacks.
The second classifier-based approach to proactive network defense represents attacker–defender coevolution as a hybrid dynamical system (HDS) [6,7], with the HDS discrete system modeling the “modes” of attack (e.g. types of DoS or data exfiltration procedures) and the HDS continuous system generating particular attack instances corresponding to the attack mode presently “active.” Our algorithm takes as input potential near-future modes of attack, obtained for example from the insights of cyber analysts, and generates synthetic attack data for these modes of malicious activity; these data are then combined with recently observed attacks to train a simple classifier to be effective against both current and (near) future attacks. The utility of these proactive filter-based methods is demonstrated by showing that they outperform standard techniques for the task of distinguishing innocent and malicious network behaviors in analyses of two publicly available cyber datasets.
An alternative approach to proactive network defense is to consider the problem of anticipating and characterizing impending attack events with enough specificity and lead time to allow mitigating defensive actions to be taken. We also explore this approach in the chapter, proposing a novel early warning method as a solution to this problem. The proposed warning method is based upon the fact that certain classes of attacks require the attackers to coordinate their actions, often through social media or other observable channels, and exploits signatures generated by this coordination to provide effective attack warning. Interestingly, the most useful early warning indicator identified in this exploratory study is not one of the standard metrics for social media activity, but instead is a subtle measure of the way attack coordination interacts with the topology of relevant online social networks. The potential of the early warning approach to proactive cyber defense is illustrated through a case study involving politically motivated Internet-scale attacks.
2.2 Proactive Filters
In this section we propose two filter-based methods for proactive network defense and demonstrate their utility through analysis of publicly available computer network security-related datasets.
2.2.1 Preliminaries
We approach the task of protecting computer networks from attack as a classification problem, in which the objective is to distinguish innocent and malicious network activity. Each instance of network activity is represented as a feature vector x ∈ ℜ|F|, where entry xi of x is the value of feature i: for instance, x and F is the set of instance features or attributes of interest (x may be normalized in various ways [7]). Instances can belong to one of two classes: positive/innocent and negative/malicious; generalizing to more than two classes is straightforward. We wish to learn a vector c ∈ ℜ|F| such that the classifier orient = sign(cTx) accurately estimates the class label of behavior x, returning +1 (−1) for innocent (malicious) activity.
Knowledge-based classifiers leverage prior domain information to construct the vector c. One way to obtain such a classifier is to assemble a “lexicon” of innocent/positive features F+ ⊆ F and malicious/negative features F− ⊆ F, and to set ci = +1 if feature i belongs to F+, ci = −1 if i is in F− and ci = 0 otherwise; this classifier simply sums the positive and negative feature values in the instance and assigns instance class accordingly. Unfortunately this sort of scheme is unable to improve its performance or adapt to new domains, and consequently is usually not very useful in cyber security applications.
Alternatively, learning-based methods attempt to generate the classifier vector c from examples of innocent and malicious network activity. To obtain a learning classifier, one can begin by assembling a set of nl labeled instances {(xi, di)}, where di ∈ {+1, −1} is the class label for instance i. The vector c is then learned through training with the set {(xi, di)}, for example by solving the following set of equations for c:
![]() (2.1)
(2.1)
where matrix X ∈ ℜnl×|F| has instance feature vectors for rows, d ∈ ℜnl is the vector of instance labels, I|F| denotes the |F| × |F| identity matrix, and γ ≥ 0 is a constant; this corresponds to regularized least squares (RLS) learning [8]. Many other learning strategies can be used to compute c [8]. Learning-based classifiers have the potential to improve their performance and adapt to new situations, but realizing these capabilities typically requires that large training sets of labeled attacks be obtained. This latter characteristic represents a significant drawback for cyber security applications, where it is desirable to be able to recognize new attacks given only a few (or even no) examples.
In this section we present two new learning-based approaches to cyber defense that are able to perform well with only very modest levels of prior knowledge regarding the attack classes of interest. The basic idea is to leverage “auxiliary” information that is readily available in cyber security applications. More specifically, the first proposed method is a transfer learning algorithm [9] that permits the information present in data from previous attacks to be transferred for implementation against new attacks. The second approach uses prior knowledge concerning attack “modes” to generate synthetic attack data for use in training defense systems, resulting in networks defenses that are effective against both current and (near) future attacks.
2.2.2 Algorithm 1: Transfer Learning
We begin by deriving a bipartite graph-based transfer learning algorithm for distinguishing innocent and malicious network behaviors, and then demonstrate the algorithm’s effectiveness through a case study using publicly available network-intrusion data obtained from the KDD Cup archive [10]. The basic hypothesis is simple and natural: Because attacker/defender behavior coevolves, previous activity should provide some indication of future behavior, and transfer learning is one way to quantify and operationalize this intuition.
Proposed algorithm
The development of the proposed algorithm begins by modeling the problem data as a bipartite graph Gb, in which instances of network activity are connected to their features (see Figure 2.1). It is easy to see that the adjacency matrix A for graph Gb is given by
![]() (2.2)
(2.2)

Figure 2.1 Cartoon of bipartite graph model Gb. Instances of network activity (white vertices) are connected to the features (black vertices) that characterize them, and link weights (black edges) reflect the magnitudes taken by the features in the associated instances.
where matrix X ∈ ℜn×|F| is constructed by stacking the n instance feature vectors as rows, and each “0” is a matrix of zeros. In the proposed algorithm, the bipartite graph model Gb is used to exploit the relationships between instances and features by assuming that, in Gb, positive/negative instances will tend to be connected to positive/negative features. Note that, as shown below, the learning algorithm can incorporate both instance labels and feature labels (if available). In the case of the latter it is assumed that the feature labels are used to build vector w ∈ ℜ|F|, where the entries of w are set to +1 (innocent), −1 (malicious), or 0 (unknown) according to the polarity of the corresponding features.
Many cyber security applications are characterized by the presence of limited labeled data for the attack class of interest but ample labeled information for a related class of malicious activity. For example, an analyst may be interested in detecting a new class of attacks, and may have in hand a large set of labeled examples of normal network behavior as well as attacks that have been experienced in the recent past. In this setting it is natural to adopt a transfer learning approach, in which knowledge concerning previously observed instances of innocent/malicious behavior, the so-called source data, is transferred to permit classification of new target data. In what follows we present a new bipartite graph-based approach to transfer learning that is well suited to cyber defense applications.
Assume that the initial problem data consists of a collection of n = nT + nS network events, where nT is the (small) number of labeled instances available for the target domain; that is, examples of network activity of current interest, and nS![]() nT is the number of labeled instances from some related source domain, say reflecting recent innocent and malicious activity; suppose also that a modest lexicon Fl of labeled features is known (this set can be empty). Let this label data be used to encode vectors dT ∈ ℜnT, dS ∈ ℜnS, and w ∈ ℜ|F| respectively. We denote by dT,est ∈ ℜnT, dS,est ∈ ℜnS, and c ∈ ℜ|F| the vectors of estimated class labels for the target and source instances and the features, and define the augmented classifier caug =
nT is the number of labeled instances from some related source domain, say reflecting recent innocent and malicious activity; suppose also that a modest lexicon Fl of labeled features is known (this set can be empty). Let this label data be used to encode vectors dT ∈ ℜnT, dS ∈ ℜnS, and w ∈ ℜ|F| respectively. We denote by dT,est ∈ ℜnT, dS,est ∈ ℜnS, and c ∈ ℜ|F| the vectors of estimated class labels for the target and source instances and the features, and define the augmented classifier caug = ![]() ∈ ℜn+|F|. Note that the quantity caug is introduced for notational convenience in the subsequent development and is not directly employed for classification.
∈ ℜn+|F|. Note that the quantity caug is introduced for notational convenience in the subsequent development and is not directly employed for classification.
We derive an algorithm for learning caug, and therefore c, by solving an optimization problem involving the labeled source and target training data, and then use c to estimate the class label of any new instance of network activity via the simple linear classifier orient = sign(cTx). This classifier is referred to as transfer learning-based because c is learned, in part, by transferring knowledge about the way innocent and malicious network behavior is manifested in a domain that is related to (but need not be identical to) the domain of interest.
We wish to learn an augmented classifier caug with the following four properties: (1) if a source instance is labeled, then the corresponding entry of dS,est should be close to this ±1 label; (2) if a target instance is labeled, then the corresponding entry of dT,est should be close to this ±1 label, and the information encoded in dT should be emphasized relative to that in the source labels dS; (3) if a feature is in the lexicon Fl, then the corresponding entry of c should be close to this ±1 label; and (4) if there is an edge Xij of Gb that connects an instance i and a feature j, and Xij possesses significant weight, then the estimated class labels for i and j should be similar.
The four objectives listed above may be realized by solving the following optimization problem:
![]() (2.3)
(2.3)
where L = D − A is the graph Laplacian matrix for Gb, with D the diagonal degree matrix for A (i.e. Dii = Σj Aij), and β1, β2, β3, kS, and kT are non-negative constants. Minimizing (2.3) enfor-ces the four properties we seek for caug. More specifically, the second, third, and fourth terms penalize “errors” in the first three properties, and choosing β2 > β1 and kT > kS favors target label data over source labels. To see that the first term enforces the fourth property, note that this expression is a sum of components of the form Xij(dT,est,i − cj)2 and Xij(dS,est,i − cj)2. The constants β1, β2, and β3 can be used to balance the relative importance of the four properties.
The caug that minimizes the objective function (2.3) can be obtained by solving the following set of linear equations:
 (2.4)
(2.4)
where the Lij are matrix blocks of L of appropriate dimension. The system (2.4) is sparse because the data matrix X is sparse, and therefore large-scale problems can be solved efficiently. Note that in situations where the set of available labeled target instances and features is very limited, classifier performance can be improved by replacing L in (2.4) with the normalized Laplacian Ln = D−1/2LD−1/2, or with a power of this matrix ![]() (for k a positive integer).
(for k a positive integer).
We summarize the above discussion by sketching an algorithm for constructing the proposed transfer learning classifier:
Algorithm TL (Transfer Learning)
Algorithm evaluation
We now examine the performance of Algorithm TL for the problem of distinguishing innocent and malicious network activity in the KDD Cup 99 dataset, a publicly available collection of network data consisting of both normal activities and attacks of various kinds [10]. For this study we randomly selected 1000 normal connections (N), 1000 denial-of-service attacks (DoS), and 1000 unauthorized remote-access events (R2L) to serve as our test data. Additionally, small sets of each of these classes of activity were chosen at random from Ref. [10] to be used for training Algorithm TL, and a lexicon of four features, two positive and two negative, was constructed manually and employed to form the lexicon vector w.
We defined two tasks with which to explore the utility of Algorithm TL. In the first, the goal is to distinguish N and DoS instances, and it is assumed that the following data is available to train Algorithm TL: (1) a set of dS/2 labeled N and dS/2 labeled R2L instances (source data), (2) a set of dT/2 labeled N and dT/2 labeled DoS instances (target data), and (3) the four lexicon features. Thus, the source domain consists of N and R2L activities and the target domain is composed of N and DoS instances. In the second task the situation is reversed – the objective is to distinguish N and R2L activities, the source domain is made up of dS (total) labeled N and DoS instances, and the target domain consists of dT (total) N and R2L instances. In all tests the number of labeled source instances is dS = 50, while the number of target instances dT is varied to explore the way classifier performance depends on this key parameter. Of particular interest is determining if it is possible to obtain good performance with only limited target data, as this outcome would suggest both that useful information concerning a given attack class is present in other attacks and that Algorithm TL is able to extract this information.
This study compared the classification accuracy of Algorithm TL with that of a well-tuned version of the RLS algorithm (1) and a standard naïve Bayes (NB) algorithm [11]; as the accuracies obtained with the RLS and NB methods were quite similar, we report only the RLS results. Algorithm TL was implemented with the following parameter values: β1 = 1.0, β2 = 3.0, β3 = 5.0, kS = 0.5, kT = 1.0, and k = 5. We examined training sets which incorporated the following numbers of target instances: nT = 5, 10, 20, 30, 40, 50, 60. As in previous studies (see, for example, Ref. [10]), only the 34 “continuous features” were used for learning the classifiers.
Sample results from this study are depicted in Figure 2.2. Each data point in the plots represents the average of 100 trials. It can be seen that Algorithm TL outperforms the RLS classifier (and also the standard NB algorithm, not shown), and that the difference in accuracy of the methods increases substantially as the volume of training data from the target domain becomes small. The performance of Algorithm TL for this task is also superior to that reported for other learning methods tested on these data [12]. The ability of Algorithm TL to accurately identify a novel attack after seeing only a very few examples of it, which is a direct consequence of its ability to transfer useful knowledge from related data, is expected to be of considerable value for a range of cyber security applications.

Figure 2.2 Performance of Algorithm TL with limited labeled data. The plot shows how classifier accuracy (vertical axis) varies with the number of available labeled target instances (horizontal axis) for four tasks: distinguish N and DoS using RLS classifier, distinguish N and DoS using Algorithm TL, distinguish N and R2L using RLS classifier, and distinguish N and R2L using Algorithm TL.
Finally, it is interesting to observe that the bipartite graph formulation of Algorithm TL permits useful information to be extracted from network data even if no labeled instances are available. More specifically, we repeated the above study for the case in which dT = dS = 0; that is, when no labeled instances are available in either the target or source domains. The knowledge reflected in the lexicon vector w is still made available to Algorithm TL. As shown in Figure 2.3, employing a “lexicon only” classifier, in which the vector w is used to build a knowledge-based scheme as described in Section 2.2.1, yields a classification accuracy that is not much better than the 50% baseline achievable with random guessing. However, using this lexicon information together with Algorithm TL enables useful classification accuracy to be obtained (see Figure 2.3). This somewhat surprising result can be explained as follows: The “clustering” property of Algorithm TL encoded in objective function (2.3) allows the domain knowledge in the lexicon to leverage latent information present in the unlabeled target and source instances, thereby boosting classifier accuracy.

Figure 2.3 Performance of Algorithm TL when no labeled instances are available. The bar graphs depict classifier accuracy for four tasks: distinguish N and DoS using a lexicon-only (LO) classifier (left, gray bar), distinguish N and DoS using lexicon-learning (LL) via Algorithm TL (left, black bar), distinguish N and R2L using an LO classifier (right, gray bar), and distinguish N and R2L using LL via Algorithm TL (right, black bar).
2.2.3 Algorithm 2: Synthetic Attack Generation
In this section we derive our second filter-based algorithm for distinguishing normal and malicious network activity and demonstrate its effectiveness through a case study using the publicly available Ling-Spam dataset [13]. Again the intuition is that attacker/defender coevolution should make previous activity somewhat indicative of future behavior, and in the present case we operationalize this notion by generating “predicted” attack data and using this synthetic data for classifier training.
Proposed algorithm
The development of the second approach to proactive filter-based defense begins by modeling attacker/defender interaction as a stochastic hybrid dynamical system (S-HDS). Here we present a brief, intuitive overview of the basic idea; a comprehensive description of the modeling procedure is given in Ref. [7]. An S-HDS (see Figure 2.4) is a feedback interconnection of a discrete-state stochastic process, such as a Markov chain, with a family of continuous-state stochastic dynamical systems [6,14]. Combining discrete and continuous dynamics within a unified, computationally tractable framework offers an expressive, scalable modeling environment that is amenable to formal mathematical analysis. In particular, S-HDS models can be used to efficiently represent and analyze dynamic phenomena that evolve on multiple time scales [14], a property of considerable value in the present application.

Figure 2.4 Schematic of basic S-HDS feedback structure. The discrete and continuous systems in this framework model the adversary’s selection of attack “mode” and resulting attack behavior respectively, which arise from the coevolving attacker–defender dynamics.
As a simple illustration of the way the S-HDS formalism enables effective, efficient mathematical representation of cyber phenomena, consider the task of modeling the coevolution of spam attack methods and spam filters. At an abstract but still useful level, one can think of spam–spam filter dynamics as evolving on two timescales:
• The slow timescale, which captures the evolution of attack strategies; as an example, consider the way early spam filters learned to detect spam by identifying words that were consistently associated with spam, and how spammers responded by systematically modifying the wording of their messages, for instance via “add-word” (AW) and “synonym” attacks [15].
• The fast timescale, which corresponds to the generation of particular attack instances for a given “mode” of attack (for example, the synthesis of spam messages according to a specific AW attack method).
We show in Ref. [7] that a range of adversarial behavior can be represented within the S-HDS framework, and derive simple but reasonable models for spam–spam filter dynamics and for basic classes of network intrusion attacks.
In Ref. [14] we develop a mathematically rigorous procedure for predictive analysis for general classes of S-HDS. Among other capabilities, this analytic methodology enables the predictability of given dynamics to be assessed and the predictive measurables (if any) to be identified. Applying this predictability assessment process to the adversarial S-HDS models constructed in Ref. [7] reveals that, for many of these models, the most predictive measurable is the mode of attack; that is, the state variable for the discrete system component of the S-HDS (see Ref. [7] for a detailed description of this analysis). Observe that this result is intuitively sensible.
This analytic finding suggests the following synthetic data learning (SDL) approach to proactive defense: First, identify the mode(s) of attack of interest. For attacks that are already under way, Ref. [7] offers an S-HDS discrete-system state estimation method that allows the mode to be inferred using only modest amounts of measured data. Alternatively, and of more interest in the present application, it is often possible to identify likely future attack modes through analysis of auxiliary information sources (e.g. the subject-matter knowledge possessed by domain experts or “non-cyber” data such as that found in social media [16–18]).
Once a candidate attack mode has been identified, synthetic attack data corresponding to the mode can be generated by employing one of the S-HDS models derived in Ref. [7]. The synthetic data take the form of a set of K network attack instance vectors, denoted AS = {xS1, …, xSK}. The set AS can then be combined with (actual) measurements of L normal network activity instances, NM = {xNM1, …, xNML}, and P (recently) observed attacks, AM = {xM1, …, xMP}, yielding the training dataset TR = NM ∪ AM ∪ AS of real and synthetic data. Note that one effective way to generate a set AS of synthetic attacks is to use the S-HDS formalism to appropriately transform attack instances sampled from the observed attack set AM, rather than to attempt to construct synthetic attacks “from scratch.” It is hypothesized that training classifiers with dataset TR may offer a mechanism for deriving defenses that are effective against both current and near-future malicious activity.
We summarize the above discussion by sketching a procedure for constructing the proposed SDL classifier:
Algorithm SDL (Synthetic Data Learning)
1. Identify the mode(s) of attack of interest (e.g. via domain experts or auxiliary data).
2. Assemble sets of measured normal network activity NM and measured attack activity AM for the network under study.
3. Generate a set of synthetic attack instances AS corresponding to the attack mode(s) identified in step 1 (for instance by transforming attacks in AM).
4. Train a classifier (e.g. RLS, NB) using the training data TR = NM ∪ AM ∪ AS. Estimate the class label (innocent or malicious) of any new network activity x with the classifier trained using data TR.
Algorithm evaluation
We now examine the performance of Algorithm SDL for the problem of distinguishing legitimate and spam emails in the Ling-Spam dataset [13], a corpus of 2412 non-spam emails collected from a linguistics mailing list and 481 spam emails received by the list. After data cleaning and random subsampling of the non-spam messages we are left with 468 spam and 526 non-spam messages for training and testing purposes; this set of 994 emails will be referred to as the nominal spam corpus (note that all emails were preprocessed using the ifile tool [19]).
We considered three scenarios in this study:
1. NB classifier/nominal spam: For each of 10 runs, the nominal spam corpus was randomly divided into equal-sized training and testing sets and the class label for each message in the test set was estimated with a naïve Bayes (NB) algorithm [11] learned on the training set.
2. NB classifier/nominal plus attack spam: For each of 10 runs, the nominal spam corpus was randomly divided into equal-sized training and testing sets and the test set was then augmented with 263 additional non-spam messages (taken from the Ling-Spam dataset) and 234 spam messages generated via a standard add-word (AW) attack methodology [15]; the class labels for the test messages were estimated with an NB algorithm [11] learned on the nominal spam training set.
3. Algorithm SDL/nominal plus attack spam: For each of 10 runs, the training and test corpora were constructed exactly as in Scenario 2 and the class labels for the test messages were estimated with Algorithm SDL.
In generating the AW attacks in Scenarios 2 and 3, we assume that the attacker knows to construct AW spam to defeat an NB filter but does not have knowledge of the specific filter involved [15]. The synthetic AW attacks generated in Scenario 3 (using step 3 of Algorithm SDL) are computed with no knowledge of the attacker’s methodology beyond the mode of attack (i.e. AW).
Sample results from this study are displayed in Figure 2.5. In each case the “confusion matrix” [8] reports the (rounded) average performance over the 10 runs. It can be seen that, as expected, the NB filter does well against the nominal spam but poorly against the AW spam (in fact, the NB filter does not detect a single instance of AW spam). In contrast, Algorithm SDL performs well against both nominal spam and AW spam, achieving ~96% classification accuracy with a low false-positive rate. It is emphasized that this result is obtained using only the (synthetic) estimate of AW spam generated in step 3 of Algorithm SDL.

Figure 2.5 Performance of Algorithm SDL on spam dataset. Each confusion matrix shows number of non-spam messages classified as non-spam and spam (left column) and number of spam messages classified as non-spam and spam (right column). The three matrices, from top to bottom, report the results for: NB against nominal spam, NB against spam that contains add-word attacks, and Algorithm SDL against spam that contains add-word attacks.
2.3 Early Warning
In this section we develop an early warning capability for an important class of computer network attacks and illustrate its potential through a case study involving politically motivated DoS attacks.
2.3.1 Preliminaries
Computer network attacks take many forms, including system compromises, information theft, and denial-of-service attacks intended to disrupt services. In what follows we focus on deriving an early warning capability for distributed denial-of- service (DDoS) attacks; that is, coordinated efforts in which computers are instructed to flood a victim with traffic designed to overwhelm services or consume bandwidth. In particular, we concentrate on politically motivated DDoS attacks, for three main reasons: (1) this class of attacks is an important and growing threat [17], (2) this class is representative of other threats of interest, and (3) it is expected that in the case of politically motivated attacks the coordination among attackers may take place, in part, via social media, thereby enabling an analysis employing only publicly available data.
Consider the task of detecting social media signatures associated with attackers coordinating a politically motivated DDoS. A classic example of the kind of attack of interest is the sequence of DDoS attacks that were launched against government and commercial sites in Estonia beginning in late April 2007. Interestingly, a retrospective study of these events reveals that there was significant planning and coordination among attackers through web forums and blogs prior to the actual attacks [17], supporting the hypothesis that it may be possible to detect early warning indicators in social media in advance of such attacks.
Of course, detecting early warning indicators of an impending DDoS attack in social media is a daunting undertaking. Challenges associated with this task include the vast volume of discussions taking place online, the need to distinguish credible threats from irrelevant chatter, and the necessity to identify reliable attack indicators early enough to be useful (e.g. at least a few days in advance of the attack). Recently we have developed a general framework within which to study this class of early warning problem [14,18,20]. The basic premise is that generating useful predictions about social processes, such as the planning and coordination of a DDoS event, requires careful consideration of the way individuals interact through their social networks. The proposed warning methodology therefore exploits information about social network interactions to forecast which nascent online discussions will ultimately lead to real-world attack events and which will fade into obscurity. Interestingly, the features found to possess exploitable predictive power turn out to be subtle measures of the network dynamics associated with the evolution of early attack-related discussions [14,18,20].
We now briefly summarize the early warning framework presented in Refs [14,18,20] and its application to the DDoS warning problem, and then illustrate the implementation and performance of the warning method through a case study involving politically motivated Internet attacks.
2.3.2 Early Warning Method
In social dynamics, individuals are often affected by what others do. As a consequence, social phenomena can depend upon the topological features of the underlying social network, for instance the degree distribution or presence of small world structure, and aspects of this dependence have been characterized (see Ref. [21] for a recent review). We show in Refs [14,18,20] that, for a wide range of social phenomena, useful prediction requires consideration of the way the behavior of individuals interacts with social network communities; that is, densely connected groupings of individuals that have only relatively few links to other groups. The concept of network community structure is illustrated in Figure 2.6 and is defined more carefully below. This dependence suggests that in order to derive useful early warning methods for social phenomena, one should consider the topology of the underlying social network; however, standard prediction algorithms do not include such features.

Figure 2.6 Network community structure. Diagram on the left depicts a network with three communities; graph on the right is a network of political blogs in which community of liberal blogs (left cluster) and community of conservative blogs (right cluster) are clearly visible [22].
While community structure is widely appreciated to be an important topological property in real-world social networks, there is not a similar consensus regarding qualitative or quantitative definitions for this concept. Here we adopt the modularity-based definition proposed in Ref. [23], whereby a good partitioning of a network’s vertices into communities is one for which the number of edges between putative communities is smaller than would be expected in a random partitioning. To be concrete, a modularity-based partitioning of a network into two communities maximizes the modularity Q, defined as
![]() (2.5)
(2.5)
where m is the total number of edges in the network, the partition is specified with the elements of vector s by setting si = 1 if vertex i belongs to community 1, and si = −1 if it belongs to community 2, and matrix B has elements Bij = Aij − kikj/2m, with Aij and ki denoting the network adjacency matrix and degree of vertex i respectively. Partitions of the network into more than two communities can be constructed recursively [23]. Note that modularity-based community partitions can be efficiently computed for large social networks and require only network topology data for their construction.
Despite the fact that community structure is ubiquitous in real social networks, little has been done to incorporate considerations of communities into social prediction methods. In Refs [14,18,20] we present theoretical and empirical evidence that the predictability of social dynamics often depends crucially upon network community structure. More specifically, we show that early dispersion of a social dynamics “activity” across network communities is a reliable early indicator that the ultimate extent of the activity will be significant. (Perhaps surprisingly, this measure is more predictive than the early magnitude of the activity.)
In the context of early warning for politically motivated cyber attacks, the social activity of interest is communication associated with planning and coordinating the attack. Thus, it is of interest to collect data that enable quantification of the extent to which early communications of this type are dispersed across network communities. Such data should therefore include social network information sufficient to allow the identification of network communities as well as the detection of attack-related discussions among individuals in the network. One way to address this challenge is to adopt online social activity as a proxy for real-world attack-related discussion and information exchange. More specifically, we use blog posts as our primary dataset. The blog network is modeled as a graph in which the vertices are blogs and the edges represent links between blogs, with two blogs being linked if a post in one hyperlinks to a post in the other. Among other things, this blog graph model enables the identification of blog communities: These are the groups of blogs corresponding to the blog graph partition that maximizes the modularity Q for the graph (see (2.5)); these groups of blogs serve as our proxy for social network communities.
We are now in a position to specify an early warning algorithm for politically motivated DDoS attacks. The algorithm operationalizes the “early dispersion of attack-related discussions” indicator, computing a measure of the magnitude of this dispersion and issuing an alert if and only if the dispersion is “large.”
Algorithm EW (Early Warning):
Initialization: Identify a (large) set of cyber security-relevant blogs and forums B to be continually monitored; B should include sites contributed to and frequented by both attackers (e.g. hacker forums) and defenders (e.g. security blogs).
Procedure:
1. Perform meme detection with the blogs in B to identify all “memes” that are potentially related to politically motivated DDoS attacks. Characterize the discussion topic(s) associated with each meme.
2. Conduct a sequence of blog graph crawls and construct a time series of blog graphs GB(t). For each meme/topic M of interest and each time period t, label the blogs in GB(t) as “active” if they contain a post containing M and “inactive” otherwise.
3. Form the union GB = ∪tGB(t), partition GB into network communities, and map the communities structure of GB back to each of the graphs GB(t).
4. Compute the post volume time series and the post/community entropy (PCE) time series for each meme/topic.
5. Construct a synthetic ensemble of PCE time series from the post volume dynamics for each meme/topic.
6. Compare the actual PCE time series to the synthetic ensemble series for each meme/topic M to determine if the observed early dispersion of activity across communities is “large” for topic M.
We now offer additional details concerning this procedure; a more comprehensive discussion of the methodology is provided in Ref. [7]. Step 1 is performed using the algorithm described in Refs [20,24]. Observe that “memes” in this context are distinctive phrases that propagate relatively unchanged online and act as “tracers” for topics of discussion. It is shown in Refs [20,24] that detecting memes in social media is a useful and general way to discover emerging topics and trends, and we demonstrate in Ref. [7] that meme analysis allows the detection of discussions concerning the planning and coordination of politically motivated DDoS within a day or two of the initiation of these discussions.
Step 2 is by now standard, and various tools exist that can perform these tasks [25]. In step 3, blog network communities are identified with a modularity-based community extraction algorithm applied to the blog graph [23]. In step 4, the post volume for a given meme/topic M, community i, and sampling interval t is obtained by counting the number of posts containing M made to the blogs comprising community i during interval t. PCE for a particular meme/topic M and sampling interval t is defined as follows:
![]() (2.6)
(2.6)
where fM,i(t) is the fraction of total posts containing M and is made during interval t, which occurs in community i. Given the post volume time series obtained in step 4, step 5 involves construction of an ensemble of PCE time series that would be expected under “normal circumstances”; that is, if meme M propagated from a small seed set of initiators according to standard models of social diffusion [18,20]. Observe that this step enables us to quantify the expected dispersion for PCEM(t), so that we can recognize “large” dispersion. Step 6 is carried out by searching for memes M and time periods t during which PCEM(t) exceeds the mean of the synthetic PCE ensemble by a user-defined threshold (e.g. two standard deviations).
2.3.3 Case Study: Politically Motivated DDoS
This subsection reports the results of a case study aimed at exploring the ability of Algorithm EW to provide reliable early warning for DDoS attacks. Toward this end, we first identified a set of Internet “disturbances” that included examples from three distinct classes of events:
1. Successful politically motivated DDoS attacks – these are the events for which Algorithm EW is intended to provide warning with sufficient lead time to allow mitigating actions to be taken.
2. Natural events that disrupt Internet service – these are disturbances, such as earthquakes and electric power outages, that impact the Internet but for which it is known that no early warning signal exists in social media.
3. Quiet periods – these are periods during which there is social media “chatter” concerning impending DDoS attacks but ultimately no (successful) attacks occurred.
Including events selected from these three classes in the case study is intended to provide a fairly comprehensive test of Algorithm EW. For instance, these classes correspond to (1) the domain of interest (DDoS attacks), (2) a set of disruptions that impact the Internet but have no social media warning signal, and (3) a set of “non-events” that do not impact the Internet but do possess putative social media warning signals (discussion of DDoS attacks).
We selected 20 events from these three classes:
Politically motivated DDoS attacks
• CNN/China incident in April 2008
• Israel/Palestine conflict event in January 2009
• DDoS associated with Iranian elections in June 2009
• WikiLeaks event in November 2010
Natural disturbances
• European power outage in November 2006
• Taiwan earthquake in December 2006
• Hurricane Ike in September 2008
• Mediterranean cable cut in January 2009
Quiet periods
Seven periods, from March 2005 through March 2011, during which there were discussions in social media of DDoS attacks on various US government agencies but no (successful) attacks occurred.
For brevity, a detailed discussion of these 20 events is not given here; the interested reader is referred to Ref. [7] for additional information on these disruptions.
We collected two forms of data for each of the 20 events: cyber data and social data. The cyber data consist of time series of routing updates that were issued by Internet routers during a one-month period surrounding each event. More precisely, these data are the Border Gateway Protocol (BGP) routing updates exchanged between gateway hosts in the Autonomous System network of the Internet. The data were downloaded from the publicly accessible RIPE collection site [26] using the process described in Ref. [27] (see Ref. [27] for additional details and background information on BGP routing dynamics). The temporal evolution of the volume of BGP routing updates (e.g. withdrawal messages) gives a coarse-grained measure of the timing and magnitude of large Internet disruptions and thus offers a simple and objective way to characterize the impact of each of the events in our collection. The social data consist of time series of social media mentions of cyber-related memes detected during a one-month period surrounding each of the 20 events. These data were collected using the procedure specified in Algorithm EW.
Illustrative time series plots corresponding to two events in the case study, the WikiLeaks DDoS attack in November 2010 and Japan earthquake in March 2011, are shown in Figure 2.7. Observe that the time series of BGP routing updates are similar for the two events, with each experiencing a large “spike” at the time of the event. The time series of blog post volume are also similar across the two events, with each showing modest volume prior to the event and displaying a large spike in activity at event time. However, the time series for blog entropy are quite distinct for the two events. Specifically, in the case of the WikiLeaks DDoS the blog entropy (dashed curve in Figure 2.7) experiences a dramatic increase several days before the event (and leads post volume), while in the case of the Japan earthquake blog entropy is small for the entire collection period (and lags post volume). Similar social media behavior is observed for all events in the case study, suggesting that: (1) early dispersion of discussions across blog network communities may be a useful early warning indicator for politically motivated DDoS attacks, and (2) the post volume associated with these discussions does not appear to be a useful early indicator for these attacks.
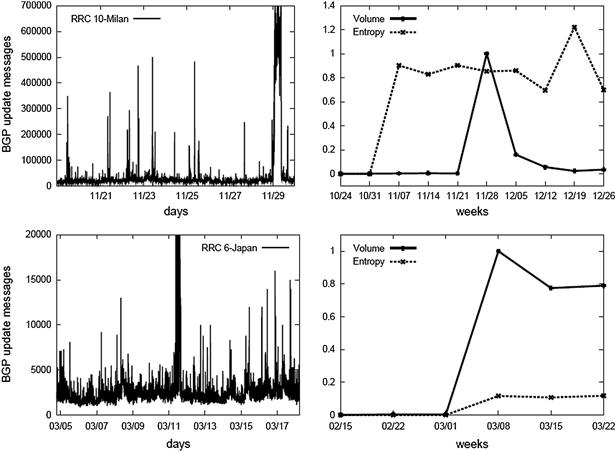
Figure 2.7 Sample results for the DDoS early warning case study. The illustrative time series plots shown correspond to the WikiLeaks event in November 2010 (top row) and the Japan earthquake in March 2011 (bottom row). For each event, the plot at left is the time series of BGP routing update message counts (note the large increase in updates triggered by the event). The plot on the right of each row is the time series of the social media data, with the solid curve showing blog post volume and the dashed curve depicting blog entropy (in each case, the time series shown are for the meme with largest total volume). Note that while post volume is scaled for convenient visualization, the scale for entropy is consistent across plots to allow cross-event comparison.
To investigate this possibility more carefully, we evaluated the predictive performance of two candidate early warning signals on the 20 events in our test set: (1) the “early dispersion” PCE indicator computed in Algorithm EW, and (2) a simple volume-based indicator, in which the presence or absence of significant post volume is used as a signal that a DDoS attack is imminent. We found that the PCE indicator performed well, correctly classifying all 20 events (seven attacks and 13 non-attacks) and providing an average lead time of 16 days for attack warning. In contrast, blog volume was not found to be useful for early warning, exhibiting essentially identical behavior for DDoS attacks and natural disturbances and spiking slightly after the occurrence of the disruption for all events.
2.4 Concluding Remarks
This chapter considers the problem of protecting computer networks against intrusions and other disruptions in a proactive manner. We begin by deriving two new proactive filter-based methods for network defense: (1) a bipartite graph-based transfer learning algorithm that enables information concerning previous attacks to be transferred for application against novel attacks, thereby substantially increasing the rate with which defense systems can successfully respond to new attacks, and (2) a synthetic data learning method that exploits basic threat information to generate attack data for use in learning appropriate defense actions, resulting in network defenses that are effective against both current and (near) future attacks. The utility of these two filter-based methods is demonstrated by showing that they outperform standard techniques for the task of detecting malicious network activity in two publicly available cyber datasets. We then present an early warning method as a solution to the problem of anticipating and characterizing impending attack events with sufficient specificity and timeliness to enable mitigating defensive actions to be taken. The warning method is based upon the fact that certain classes of attacks require the attackers to coordinate their actions, and exploits signatures of this coordination to provide effective attack warning. The potential of the warning-based approach to cyber defense is illustrated through a case study involving politically motivated Internet attacks.
Future work will include application of the proposed proactive defense methods to additional threats, including non-cyber threats that involve attacker–defender coevolution (e.g. counterterrorism), as well as the development of new proactive defense strategies. As an example of one approach toward the latter goal, we have recently shown that adversary activity can be accurately predicted and countered in certain settings by appropriately combining data analysis methods (e.g. machine learning) with behavioral models for adversarial dynamics (e.g. incremental game models) [28].
Acknowledgments
This work was supported by the Laboratory Directed Research and Development Program at Sandia National Laboratories. We thank Chip Willard of the US Department of Defense for numerous helpful discussions on aspects of this research.
References
1. Byers S, Yang S. Real-time fusion and projection of network intrusion activity. Cologne, Germany: Proc. ISIF/IEEE International Conference on Information Fusion; July 2008.
2. Armstrong R, Mayo J, Siebenlist F. Complexity science challenges in cybersecurity. Sandia National Laboratories SAND Report March 2009.
3. Colbaugh R. Does coevolution in malware adaptation enable predictive analysis? IFA Workshop. San Francisco, CA: Exploring Malware Adaptation Patterns; May 2010.
4. Mashevsky Y, Namestnikov Y, Denishchenko N, Zelensky P. Method and system for detection and prediction of computer virus-related epidemics. US Patent 7,743,419 June 2010.
5. Bozorgi M, Saul L, Savage S, Voelker G. Beyond heuristics: Learning to classify vulnerabilities and predict exploits. Washington, DC: Proc. ACM International Conference on Knowledge Discovery and Data Mining; July 2010.
6. Majumdar R, Tabuada P. Hybrid Systems: Computation and Control, LNCS 5469. Berlin: Springer; 2009.
7. Colbaugh R, Glass K. Proactive defense for evolving cyber threats. Sandia National Laboratories SAND Report September 2011.
8. Hastie T, Tibshirani R, Friedman J. The Elements of Statistical Learning. second ed. New York: Springer; 2009.
9. Pan S, Yang Q. A survey on transfer learning. IEEE Trans Knowl Data Eng. 2010;22:1345–1359.
10. <http://kdd.ics.uci.edu/databases/kddcup99/>, last accessed December 2010.
11. <http://www.borgelt.net/bayes.html>, last accessed July 2010.
12. He J, Liu Y, Lawrence R. Graph-based transfer learning. Hong Kong: Proc. ACM Conference on Information and Knowledge Management; November 2009.
13. <http://labs-repos.iit.demokritos.gr/skel/i-config/downloads/>, last accessed July 2010.
14. Colbaugh R, Glass K. Predictive analysis for social processes I: Multi- scale hybrid system modeling, and II: Predictability and warning analysis. St Petersburg, Russia: Proc. IEEE International Multi-Conference on Systems and Control; July 2009.
15. Lowd D, Meeks C. Good word attacks on statistical Spam filters. Palo Alto, CA: Proc. 2005 Conference on Email and Anti-Spam; July 2005.
16. Cao L, Yu P, Zhang C, Zhang H, Tsai F, Chan K. Blog data mining for cyber security threats, in: Data Mining for Business Applications. Springer US 2009.
17. Nazario J. Politically motivated denial of service attacks. In: The Virtual Battlefield: Perspectives on Cyber Warfare. Amsterdam: IOS Press; 2009.
18. Colbaugh R, Glass K. Early warning analysis for social diffusion events. Vancouver, Canada: Proc. IEEE International Conference on Intelligence and Security Informatics; May 2010.
19. <http://www.nongnu.org/ifile/>, last accessed July 2010.
20. Colbaugh R, Glass K. Emerging topic detection for business intelligence via predictive analysis of ‘meme’ dynamics. Palo Alto, CA: Proc. AAAI 2011 Spring Symposium; March 2011.
21. Easley D, Kleinberg J. Networks Crowds, and Markets: Reasoning About a Highly Connected World. New York: Cambridge University Press; 2010.
22. Adamic L, Glance N. The political blogosphere and the 2004 U.S election: Divided they blog. Chicago: Proc. ACM International Conference on Knowledge Discovery and Data Mining; August 2005.
23. Newman M. Modularity and community structure in networks. Proc Natl Acad Sci U.S.A. 2006;103(23):8577–8582.
24. Leskovec J, Backstrom L, Kleinberg J. Meme-tracking and the dynamics of the news cycle. Paris, France: Proc. ACM International Conference on Knowledge Discovery and Data Mining; June 2009.
25. Glass K, Colbaugh R. Web analytics for security informatics. Athens, Greece: Proc. European Intelligence and Security Informatics Conference; September 2011.
26. <http://data.ris.ripe.net/>, last accessed July 2011.
27. Glass K, Colbaugh R, Planck M. Automatically identifying the sources of large Internet events. Vancouver, Canada: Proc. IEEE International Conference on Intelligence and Security Informatics; May 2010.
28. Colbaugh R. Monsoons, movies, memes, and genes: Combining KD and M&S for prediction, Keynote Talk, KDMS Workshop. San Diego, CA: ACM International Conference on Knowledge Discovery and Data Mining; August 2011.