

Performance tools
The IBM i operating system and its licensed products include various applications for collecting, analyzing, and reporting performance data that are generically called performance tools or performance analysis tooling. There are basically two components in the product:
•The collection services that capture data about how the hardware resources of a physical and virtual system are used by the various user and system functions that support the business of a client.
•The tools for viewing, modeling, aggregating, and analyzing data. Although these tools still support a fixed function terminal (for example, 5250 or a telnet client), most of them are using either a browser-based or a specific client software.
|
Important: Do not confuse the term performance tools with the licensed product 5770-PT1 Performance Tools.
|
These performance tools cover three areas of systems management:
•Performance and capacity management
•Diagnostic analysis of processes within a system context
•Specific diagnostic tests for the IBM support organization
With these functions, you can set up practices for monitoring and managing your system performance to ensure that your IT infrastructure is aligned with the changing demands of your business.
This chapter describes how the Collection Services and the Analysis Tooling changed.
|
Requirement: To take advantage of all the Performance Tools enhancements that are described in this chapter, the system must have the latest levels of PTFs installed.
|
This chapter describes the following topics:
6.1 Introduction to performance tooling
This chapter starts with a brief review of how the available tools for performance and capacity management are structured.
6.1.1 Gathering data
Four distinct functions collect data on IBM i:
•Collection Services
This function provides for the collection of generic system management data. It is the primary collector of system data. You can run this function continuously to know what is happening with your system. Collection Services data is deposited into a management collection object and then converted and put into database files.
The interval data that is collected is specified by either application-defined or user-defined interval data. This Collection Services is part of the IBM i operating system code. This chapter refers to these Collection Services as a separate entity.
•IBM i Job Watcher
This function uses additional instrumentation for the collection of job data for any or all jobs, threads, and tasks on the system. It provides call stacks, SQL statements, objects that are being waited on, JVM statistics, wait statistics, and more, which are used to diagnose job-related performance problems.
•IBM i Disk Watcher
This function provides for the collection of disk performance data to diagnose disk-related performance problems.
•Performance Explorer
This function provides for the collection of detailed data at a program and application level to diagnose problems. It also traces the flow of work in an application and can be used to diagnose difficult performance problems.
Application-defined performance explorer trace points, such as with Domino, NetServer, or WebSphere servers, specify the data that is collected. It is intended to be used as directed by IBM. Performance Explorer data is deposited into a management collection object and then converted and put into database files.
You can use data from all of these collectors and combine it to allow for an in-depth analysis of jobs and processes and how they use system resources.
|
Operating system functionality: All of the functions that allow the configuration of data collection, to start and end data collection, and to manage the collection objects, are part of the operating system.
|
6.1.2 Analyzing data
There are several tools and options to view, understand, and analyze data from the collection services. These tools and options are either built into the Performance Tools product, or delivered as an option or a service. This overview excludes any vendor tools or the analysis you can run using your own developed application:
•You can use the Display Performance Data GUI to view performance data that is generated by the collection services through a 5250 interface.
•The Reports function organizes Collection Services performance data and trace data in to a logical and useful format. In this release, there are no changes to this function.
•You can use the Performance Tools Graphics function to work with performance data in a graphical format. You can display the graphs interactively, or you can print, plot, or save the data to a graphics data format (GDF) file for use by other utilities.
•You can use the Investigate Data function of the IBM Navigator for IBM i to perform deep analyses of the data from a browser-based interface. For more information, see 17.16, “Performance enhancements” on page 726.
•System i Navigator provides not only an interface to view and analyze data, but you can use it to define monitoring functions for resource usage by individual, all, or selected jobs.
•The Job Watcher function of the IBM Navigator for i Performance interface is also included in Performance Tools as an option.
•The Disk Watcher function of the IBM Navigator for i Performance interface is included in Performance Tools.
•IBM iDoctor for IBM i provides a separate GUI interface to analyze Collection Services, Job Watcher, Disk Watcher, and Performance Explorer data.
•IBM Performance Management for Power Systems. The support for the IBM i offering automates the collection, archival, and analysis of system performance data and returns reports to help you manage system resources and capacity.
The Performance Management for Power Systems offering includes the Performance Management Agent (PM Agent). The PM Agent is a function of the operating system that provides automated collection of non-proprietary collection services data, reduces the data, and sends the data to IBM. When you send your data to IBM, you eliminate the need to store all the trending data yourself. IBM stores the data for you and provides you with a series of reports and graphs that show your server's growth and performance. You can access your reports electronically using a traditional browser.
This offering, when used with the IBM Systems Workload Estimator, allows you to understand how your business trends relate to the timing of required hardware upgrades, such as processor or disk. The IBM Systems Workload Estimator can size a systems consolidation or evaluate upgrading a system with logical partitions by having PM Agent send the data for multiple systems or partitions to the IBM Systems Workload Estimator.
6.2 Overview of data collection in IBM i 7.1
This section describes the changes in the collection profiles and in the data file that is kept when you collect performance information with the following details:
•These items are adapted to allow an in-depth analysis of the activities on the system to set up the preferred practices to analyze the behavior of applications on a system.
•These items provide valuable information about how the workload is built up and how to create a workload management practice to reduce contention and avoid possible conflict situations.
•This information can also be used to define how to instrument and document capacity management practices of your IT infrastructure.
•You can use the IBM i performance tools to track how the performance and capacity objectives are met in an end-to-end approach.
•You can use the detailed information in different perspective that these collection services generate to shape not only the workload management of a system, but also to analyze issues that can be caused by many events.
6.2.1 Collection profiles for Collection Services
The existing collection profiles (*MINIMUM, *STANDARD, *STANDARDP and *CUSTOM) stay the same in release 7.1, but there are several categories (except for the *MINIMUM and *ENHCPCPLN profiles) added to them:
•The Standard profile now has the following additional functions:
– External storage, containing non-standardized data for disk units that are externally attached to an IBM i partition (QAPMXSTGV).
– System internal data, containing internal data for the system (QAPMSYSINT).
– Removable storage, containing data about removable storage devices that are connected to the system, more specifically, tape device data.
•The Standard Plus profile contains the same functions as the STANDARD profile with the addition of the communication protocol data and IPCS, DSP, and TCPIFC.
•For the Custom profile, which already allows for the customization of the categories, you can now also specify the intervals. This specification means that you can have different categories of data that is collected at different intervals.
Figure 6-1 shows you how to access the Configure Collection Services option.
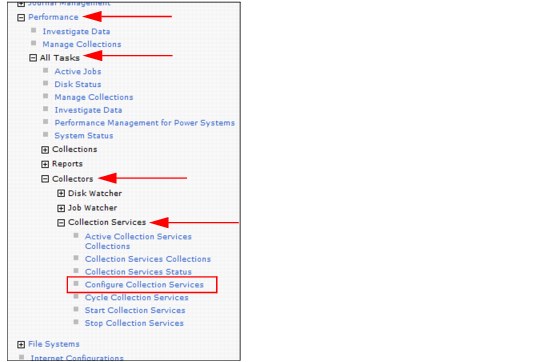
Figure 6-1 Configure Collection Services
Figure 6-2 is an example of how you can configure the Custom collection profile
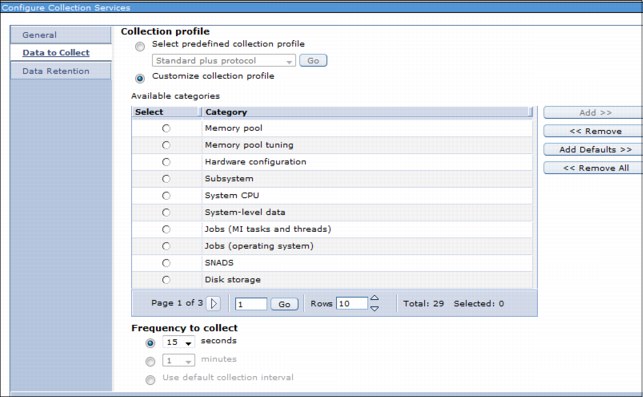
Figure 6-2 Custom collection profile settings
6.2.2 Collection Services enhancements
Table 6-1 lists the enhancements that were made to the Collection Services component of Performance Tools.
Table 6-1 Collection Services enhancements
|
Collection Services Enhancements
|
Changed File
|
7.1 PTFs
|
|
SR-IOV Ethernet physical ports
|
QAPMETHP
|
TR6 and SI47870
|
|
Job level SQL metrics
|
QAPMJOBMI
|
SI47594
|
|
IBM Storwize V7000
|
QAPMDISK
|
TR6
|
|
Active memory sharing deduplication
|
QAPMSHRMP
|
SI45848
|
|
DMPMEMINF updated to indicate page size
|
|
SI44192
|
|
SQL full open count
|
QAPMJOBOS
|
SI44183
|
|
Ethernet link aggregation
|
QAPMETH
|
SI43661
|
|
12X and P7IOC internal bus data
|
QAPMBUS
QAPMBUSINT
|
SI43661
|
|
Workload groups
|
QAPMSYSWLC
QAPMJOBMI
|
SI39804
|
|
TLBIE metrics
|
QAPMSYSINT
|
MF56871 and SI49418
|
SR-IOV Ethernet physical ports
Single Root I/O Virtualization (SR-IOV) Ethernet physical ports is a new feature that includes the following functions:
•SR-IOV virtualizes the physical ports of an adapter so that the ports can be shared by multiple partitions that are running simultaneously.
•A partition typically only has access to performance metrics for its own portion of the adapter. These partition metrics are reported by Collection Services the same way as any other Ethernet port and reported in the QAPMETH database file.
•Physical port data is reported only if the collecting partition has been authorized to obtain it. This authorization is a partition configuration attribute set on the Hardware Management Console (HMC).
•The physical port metrics are the aggregate of all the partitions using the physical port. These physical port data for Ethernet ports is now stored in the new QAPMETHP file.
•There is one record per interval per port. Port resource name can be used to uniquely associate records across intervals and to join with the records containing the virtual port Ethernet protocol statistics in the QAPMETH file.
•New metrics stored in the QAPMETHP file for Ethernet physical ports include the following data:
– Port resource name
– Frames transmitted without error
– Frames received without error
– CRC error
– More than 16 retries
– Out of window collisions
– Alignment error
– Carrier loss
– Discarded inbound frames
– Receive overruns
– Memory error
– Signal quality
– More than one retry to transmit
– Exactly one retry to transmit
– Deferred conditions
– Total MAC bytes received okay
– Total MAC bytes transmitted okay
– Transmit frames discarded
– Unsupported protocol frames
IBM i 7.1 TR6 and PTF SI47870 are required to collect these new data.
Job level SQL metrics
An updated template file for QAPMJOBMI is included with QSYS with the additional fields. This template file is only used when creating a new QAPMJOBMI file in libraries where it does not exist. Existing collection libraries (for example, QPFRDATA) that contain a prior version of QAPMJOBMI are not affected by the PTF.
The following metrics are being added to the job performance data *JOBMI category of Collection Services.
•SQL clock time (total time in SQ and below) per thread (microseconds)
•SQL unscaled CPU per thread (microseconds)
•SQL scaled CPU per thread (microseconds)
•SQL synchronous database reads per thread
•SQL synchronous nondatabase reads per thread
•SQL synchronous database writes per thread
•SQL synchronous nondatabase writes per thread
•SQL asynchronous database reads per thread
•SQL asynchronous nondatabase reads per thread
•SQL asynchronous database writes per thread
•SQL asynchronous nondatabase writes per thread
•Number of high-level SQL statements per thread
See the SI47594 PTF Cover letter special instructions at the following website:
IBM Storwize V7000
Collection Services added support in 7.1 TR6 for IBM Storwize V7000. A new flag in the QAPMDISK disk unit category (DSCAT) field indicates when a non-preferred path is in use.
The DSCAT field indicates whether the disk unit has some special characteristics that might require a special interpretation of its performance data. Each bit in this field has an independent meaning:
•X'00' = No special category applies.
•X'01' = This disk unit is in external storage media. This can also be determined by examining the device type and model for this disk unit.
•X'02' = Data on this disk unit is encrypted.
•X'04' = This is a virtual disk unit. This can also be determined by examining the device type and model for this disk unit.
•X'08' = This disk unit has an alternate path.
•X'20' = This disk unit is using a non-preferred path.
Active memory sharing deduplication
Active memory sharing (AMS) is a function that is provided on POWER7 by PowerVM. For more information about AMS, see the IBM PowerVM Active Memory™ Sharing topic in the Systems Hardware Knowledge Center:
Collection Services supports data for AMS using the file QAPMSHRMP.
AMS was later enhanced to support deduplication of active memory. Collection Services supports deduplication metrics in QAPMSHRMP using the following existing reserved fields:
•SMFIELD1: Partition logical memory deduplicated. The amount of the partition's logical memory (in bytes) mapped to a smaller set of physical pages in the shared memory pool because it was identical to other pages in the shared memory pool.
•SMFIELD4: Pool physical memory deduplicated. The amount of physical memory (in bytes) within the shared memory pool that logical pages of memory from the partitions sharing the pool have been mapped to because of deduplication.
•MPFIELD1: Unscaled deduplication time. The amount of processing time, in microseconds, spent deduplicating logical partition memory within the shared memory pool.
•MPFIELD2: Scaled deduplication time. The amount of scaled processing time, in microseconds, spent deduplicating logical partition memory within the shared memory pool.
The Collection Services support was added to 7.1 in PTF SI45848.
DMPMEMINF updated to indicate page size
The Dump Main Memory Information (DMPMEMINF) command dumps information about pages of main memory to a file. In 7.1 PTF SI44192, the output of this command has been updated to indicate whether the size of the page is 4 K or 64 K.
For more information about DMPMEMINF, see the Dump Main Memory Information (DMPMEMINF) topic in the IBM i 7.1 Knowledge Center:
SQL full open count
Database is instrumenting a new metric for the number of full opens that occur within a job. This metric is reported by Collection Services in the QAPMJOBOS file. An existing reserved field (JBNUS) now contains this new metric.
The new and existing fields contain the total number of times the specific operation occurred within the job during the Collection Services time interval:
•New field: JBNUS
The number of native database (non-SQL) files and SQL cursors that have been fully opened. Subtracting the value within field JBLBO from JBNUS yields the number of non-SQL full opens.
•Existing fields (for SQL Cursors): JBLBO
The cumulative number of SQL cursors that have been full opened.
•Existing fields (for SQL Cursors): JBLBS
The cumulative number of SQL cursors that have been pseudo-opened. Pseudo-opens are also known as reused SQL cursors.
This support was added to 7.1 in PTF SI44183.
Ethernet link aggregation
In preparation for the Ethernet link aggregation function, the Collection Services protocol files (example QAPMETH) were updated in the base 7.1 release to provide the port resource name that is associated with the reported line. These changes are documented for each affected Collection Services file in the Collection Services data files topic in IBM i 7.1 Knowledge Center:
Collection Services support for Ethernet link aggregation was added in 7.1 PTF SI43661. With this PTF applied, the protocol files contain one record per interval for each port that is associated with a line. Therefore, multiple records for the same line occur each interval if Ethernet link aggregation is used. Each record reports data unique to activity on that port.
For more information about Ethernet link aggregation, see 9.9, “Ethernet link aggregation” on page 442.
12X and P7IOC internal bus data
The support to collect 12X and P7IOC performance data in IBM i Collection Services occurred in stages where 12X was supported first in the base 7.1 release and was followed by P7IOC support.
Data is collected and the CRTPFRDTA function exports the new data to a new file called QAPMBUSINT.
Support for P7IOC data was built on top of the 12X support. P7IOC support was added to 7.1 in PTF SI43661 and has the following parts:
•Data for the internal bus. These data were added to QAPMBUSINT with a new value for bus type (BUTYPE field) to identify these records.
•Hardware data are available for PCI buses that are attached to a P7IOC. These new PCI data are provided in the QAPMBUS file.
Workload groups
Collection Services added the support to report system-wide usage data for workload groups and thread-level data to help understand performance issues that are related to workload grouping. This support was added in 7.1 PTF SI39804.
The *JOBMI data category and QAPMJOBMI file supports more metrics that identify the group that a thread was associated with at sample time along with how much time that thread was not able to run due to workload grouping constraints. Descriptions of the QAPMJOBMI fields JBFLDR2 and JBFLDR3 can be found in the IBM i 7.1 Knowledge Center:
The *SYSLVL collection category now collects workload group data for groups that are in use. The new QAPMSYSWLC file or member is only created if the source *MGTCOL collection contains data for workload groups. Field descriptions for the new QAPMSYSWLC file can be found in the IBM i 7.1 Knowledge Center:
TLBIE metrics
Collection Services added support to capture statistics for the TLBIE instructions that are frequently needed by IBM support to help investigate performance issues. Support was added in PTFs MF56871 and SI49418. After the PTFs are applied, file QAPMSYSINT contains additional data in record type 3. Field descriptions for this file are not available in the IBM i 7.1 Knowledge Center, but are described in “QAPMSYSINT” on page 315.
6.2.3 Collection Services data files
You can generate database files from the collection objects that are maintained by Collection Services.
Performance data is a set of information about the operation of a system (or network of systems) that can be used to understand response time and throughput. You can use performance data to adjust programs, system attributes, and operations. These adjustments can improve response times and throughputs. Adjustments can also help you to predict the effects of certain changes to the system, operation, or program.
Collection Services collects performance data into a management collection object (*MGTCOL). The Create Performance Data (CRTPFRDTA) command processes data from that collection object and stores the result in performance database files. Figure 6-3 shows how to create performance data in IBM Navigator for i.
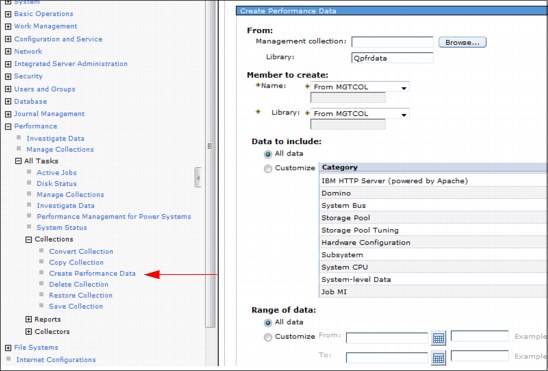
Figure 6-3 Creating performance data in IBM Navigator for i
Extra field information, such as number of bytes and buffer position, is available by using the Display File Field Description (DSPFFD) command. For example:
DSPFFD FILE(QSYS/QAPMCONF)
•Collection Services data files that contain time interval data. These files contain performance data that is collected for each interval.
•Field data for configuration database files. Configuration data is collected once per session. You can find the QAPMCONF, QAPMHDWR, and QAPMSBSD files in the configuration data files.
•Field data for trace database files. Trace data is collected only when you choose to do so. You can find the QAPMDMPT file in the trace data files.
•System category and file relationships. When you collect performance data using Collection Services, the data is stored in a management collection (*MGTCOL) object.
•Task type extender. A task type extender identifies the area of functional support that is provided by the task.
The following sections discuss some of the Collection Services data files.
For more information about the Collection Services data files, see the IBM i 7.1 Knowledge Center:
http://pic.dhe.ibm.com/infocenter/iseries/v7r1m0/index.jsp?topic=%2Frzahx%2Frzahxperfdatafiles1a.htm
QAPMBUS
This database file contains data for external system buses.
Support for a particular bus and what metrics are supported for that bus depends on the type of bus, how that bus connects to the system, and whether it is assigned to the partition.
Historically, records were produced for all PCI buses even though data was instrumented only for bus usage within the collecting partition. For that situation now, data is captured only for those buses that have activity within the collecting partition.
For newer technologies, the hardware might provide more instrumentation. Hardware metrics represent bus usage by all partitions. The collecting partition must be authorized to obtain these data (see the “Allow performance information collection” option within the HMC partition configuration). If the collecting partition is authorized, buses that support hardware metrics are reported independent of partition assignments.
Table 6-2 shows the contents of the QAPMBUS table.
Table 6-2 Contents of the QAPMBUS table
|
Column name
|
Description
|
|
INTNUM
|
Interval number: The nth sample database interval that is based on the start time in the Create Performance Data (CRTPFRDTA) command.
|
|
DATETIME
|
Interval date (mmddyy) and time (hhmmss): The date and time of the sample interval.
|
|
INTSEC
|
Elapsed interval seconds: The number of seconds since the last sample interval.
|
|
BUIOPB
|
System bus number: Bus numbering begins with one. Before V5R4, bus numbering began with zero.
|
|
BUOPSR
|
Number of OPSTARTs received: RRCB in server storage.
|
|
BUSGLR
|
Signals received.
|
|
BUOPSS
|
Number of OPSTARTs sent.
|
|
BUSGLS
|
Signals sent.
|
|
BURSTQ
|
Restart queues that are sent.
|
|
BUBNAR
|
Occurrences of BNA received.
|
|
BUTPKT
|
Total packets (sent or received).
|
|
BUKBYO
|
Kilobytes DMAed out.
|
|
BUKBYI
|
Kilobytes DMAed in.
|
|
BUNOSR
|
Normal flow OPSTARTs received.
|
|
BUNRDR
|
Reserved.
|
|
BUORQS
|
OPSTART requests sent.
|
|
BUTIMO
|
Reserved.
|
|
BUBNAS
|
Reserved.
|
|
BUQSAS
|
Queue space available sent.
|
|
BUTYPE
|
Bus type. Supported values are:
•‘S’ = SPD bus (no longer supported).
•‘P’ = PCI bus.
•‘V’ = Virtual bus.
|
|
BUCAT
|
Bus category. This field indicates if this bus record has some special characteristics, which might require a special interpretation of its performance data. Each bit in this field has an independent meaning:
•X'00' = No special category applies.
•X'01' = This bus is attached to an I/O hub.
(Note: The following might be used depending on what happens with switches.)
•X’02’= This record represents a switch. The data that is reported is the sum of all buses under the switch. The bus number that is reported is the first bus under the switch.
|
|
BUHUB
|
Hub number. If this bus is associated with an I/O hub, this number is the number of that hub. (Note: An I/O hub can be embedded in the backplane.)
|
|
BUMAXRATE
|
Maximum byte rate. When available from hardware, this rate is the estimated maximum rate that data might be both sent and received in bytes per second through the hardware port.
|
|
BUCBSND
|
Command bytes sent. When available from hardware, this number is the number of command bytes sent through the hardware port.
|
|
BUDBSBD
|
Data bytes sent. When available from hardware, this number is the number of data bytes sent through the hardware port.
|
|
BUCBRCV
|
Command bytes received. When available from hardware, this number is the number of command bytes received through the hardware port.
|
|
BUDBRCV
|
Data bytes received. When available from hardware, this number is the number of data bytes received through the hardware port.
|
QAPMBUSINT
This file contains data for internal system buses.
The metrics that are supported depend on the instrumentation within the hardware chips. Support for a particular bus depends on both the type of bus and the chip family.
There might be one or more records for each interval for a reported bus. The number of records and the metrics that are supported depend on both the bus type and chip type.
These metrics are instrumented in the hardware and represent bus usage by all partitions. The collecting partition must be authorized to obtain these data (see “Allow performance information collection” option within the HMC partition configuration.
Table 6-3 shows the contents of the QAPMBUSINT table.
Table 6-3 Contents of the QAPMBUSINT table
|
Column name
|
Description
|
|
BUNBR
|
The hardware assigned number that is associated with the bus or hub.
|
|
BUTYPE
|
Bus type. The supported bus types are:
•4 - 12X loop.
•6 - I/O hub (might be embedded in the backplane).
|
|
INTNUM
|
Interval number: The nth sample database interval based on the start time specified in the Create Performance Data (CRTPFRDTA) command.
|
|
DTETIM
|
Interval date and time. The date and time of the sample interval.
|
|
INTSEC
|
Elapsed interval seconds: The number of seconds since the last sample interval.
|
|
BUNBR
|
Bus number. The hardware assigned number that is associated with the bus or hub.
|
|
BUTYPE
|
Bus type. Supported bus types are:
•4 - 12X Loop
•6 - I/O hub (might be embedded in the backplane)
|
|
BUDFMT
|
Bus data format. This field is provided to help you understand what data are instrumented by the hardware components of the bus if there are future differences.
|
|
BUATTR1
|
Bus attribute 1. The meaning of this field depends on the bus type. One row is present for each bus type (BUTYPE) field:
•Type 4: Port identifier. One record is present for each supported port.
– 0 = even port
– 1 = odd port
•Type 6: Category.
– 0 = Topside port
|
|
BUPKTSND
|
Packets sent. Not supported for type 6.
|
|
BUPKTRCV
|
Packets received. Not supported for type 6.
|
|
BUBYTESND
|
Data bytes sent. Not supported for type 6.
|
|
BUBYTERCV
|
Data bytes received. Not supported for type 6.
|
|
BUMAXRATE
|
Maximum byte rate. The estimated maximum rate that data can be both sent and received in bytes per second.
|
|
BUDATA1
|
The meaning of this field depends on the type (BUTYPE) field:
•Type 4: Reserved.
•Type 6: Command bytes sent.
|
|
BUDATA2
|
The meaning of this field depends on the type (BUTYPE) field:
•Type 4: Reserved.
•Type 6: Command bytes received.
|
QAPMDISK
You find new entries in this table that detail, per path, the total read and write operations and worldwide node names for external disks. Table 6-4 shows the added columns.
Table 6-4 New columns in the QAPMDISK table
|
Column name
|
Description
|
|
DSPTROP
|
The path total read operations reports the number of read requests that are received by internal machine functions, which is not the same as the device read operations reported in the DSDROP field.
|
|
DSPTWOP
|
The path total write operations reports the number of write requests that are received by internal machine functions, which is not the same as the device write operations that are reported in the DSDWOP field.
|
|
DSWWNN
|
The worldwide node name is a unique identifier that represents the external storage subsystem that the disk belongs to. This value is null for non-external disks.
|
QAPMDISKRB
Up to release 6.1, the QAPMDISK table contained a detailed set of data about the performance of the disk unit. This design was kept, but complemented with a new table (QAPMDISKRB) that contains only the disk operations per interval. At the same time, it increases the number of bucket definition boundaries reported from 6 to 11, separates the read and write operations in different counters, and reports the bucket definition boundaries in microseconds instead of in milliseconds. These changes apply to all disks, internal or external. Each entry in the QAPMDISKRB table contains the number of I/O operations, the response time, and the service time. The associated disk response time boundaries (in microseconds) are reported in the QAPMCONF file in GKEY fields G1–GA, for which there is no interface to change them.
You can find the breakouts for those buckets in Table 6-5. Both QAPMDISK and QAPMDISKRB tables carry the same columns for each row (interval number and device resource name), so they can be joined for analysis.
Table 6-5 Boundaries per bucket in the QAPMDISKRB and QAPMDISK tables
|
QAPMDISKRB (microseconds)
|
QAPMDISK (milliseconds)
|
||||
|
Bucket
|
>
|
<
|
Bucket
|
>
|
<
|
|
1
|
0
|
15
|
1
|
>0
|
1
|
|
2
|
15
|
250
|
|||
|
3
|
250
|
1,000
|
|||
|
4
|
1,000
|
4,000
|
2
|
2
|
16
|
|
5
|
4,000
|
8,000
|
|||
|
6
|
8,000
|
16,000
|
|||
|
7
|
16,000
|
64,000
|
3
|
16
|
64
|
|
8
|
64,000
|
256,000
|
4
|
64
|
256
|
|
9
|
256,000
|
500,000
|
5
|
256
|
1024
|
|
10
|
500,000
|
1,024,000
|
|||
|
11
|
1,024,000
|
|
6
|
1024
|
|
QAPMETHP
This database file includes the physical port Ethernet protocol statistics for active Ethernet line descriptions that are associated with an Ethernet port on a Single Root I/O Virtualization (SR-IOV) adapter (Table 6-6).
Physical port data is reported only if the collecting partition has been authorized to obtain it. This authorization is a partition configuration attribute set on the Hardware Management Console (HMC).
There is one record per interval per port. Port resource name can be used to uniquely associate records across intervals and to join with the records that contain the virtual port Ethernet protocol statistics in the QAPMETH file.
Table 6-6 New columns in the QAPMETH table
|
Column name
|
Description
|
|
INTNUM
|
Interval number: The nth sample database interval based on the start time specified in the Create Performance Data (CRTPFRDTA) command.
|
|
DATETIME
|
Interval date (yymmdd) and time (hhmmss): The date and time of the sample interval.
|
|
INTSEC
|
Elapsed interval seconds: The number of seconds since the last sample interval.
|
|
ETMPORT
|
Port resource name.
|
|
ETMFTG
|
Frames transmitted without error.
|
|
ETMFRG
|
Frames received without error.
|
|
ETMCRE
|
CRC error: Checksum errors detected by the receiver.
|
|
ETMEXR
|
More than 16 retries: Frame unsuccessfully transmitted due to excessive retries.
|
|
ETMOWC
|
Out of window collisions: Collision occurred after slot time of channel elapsed.
|
|
JBINDCPU
|
The amount of unscaled processor time (in µs) that represents the work that is done solely within this thread without regard for how server task work is charged.
|
|
ETMALE
|
Alignment error: Inbound frame contained non-integer number of bytes and a CRC error.
|
|
ETMCRL
|
Carrier loss: Carrier input to the chipset on the IO adapters is false during transmission.
|
|
ETMDIF
|
Discarded inbound frames: Receiver discarded frame due to lack of AIF entries.
|
|
ETMROV
|
Receive overruns: Receiver has lost all or part of an incoming frame due to buffer shortage.
|
|
ETMMEE
|
Memory error: The chipset on the IO adapters is the bus master and did not receive ready signal within 25.6 microseconds of asserting the address on the DAL** lines.
|
|
ETMSQE
|
Signal quality error: Signal indicating the transmit is successfully complete did not arrive within 2 microseconds of successful transmission.
|
|
ETMM1R
|
More than one retry to transmit: Frame required more than one retry for successful transmission.
|
|
ETM1R
|
Exactly one retry to transmit: Frame required one retry for successful transmission.
|
|
ETMDCN
|
Deferred conditions: The chipset on the IO adapters deferred transmission due to busy channel
|
|
ETMBRV
|
Total MAC bytes received ok: This contains a count of bytes in frames that are successfully received. It includes bytes from received multicast and broadcast frames. This number includes everything from destination address up to but excluding FCS. Source address, destination address, length or type, and pad are included.
|
|
ETMBTR
|
Total MAC bytes transmitted ok: Total number of bytes transmitted successfully. This number includes everything from destination address up to but excluding FCS. Source address, destination address, length or type, and pad are included.
|
|
ETMTFD
|
Transmit frames discarded.
|
|
ETMUPF
|
Unsupported protocol frames: Number of frames that were discarded because they specified an unsupported protocol. This count is included in the discarded inbound frames counter.
|
QAPMJOBMI
The QAPMJOBMI table now has information about lock counts on a thread basis, providing details about which locks are held (seizes, process scoped locks, thread scoped locks, process scoped database record locks, and thread scoped database record locks held). It also holds information about the resource affinity status changes of a thread or process.
|
Cache memory access: On Power Systems, all of the processor cores on any chip can access any of the cache memory in the entire system. The management of the relationship between the processor or “node” where a task runs and the “nodal” location where that task finds its data is called Memory Resource Affinity.
|
Collection Services now includes physical I/O breakdown by SQL activity. These metrics are included in the *JOBMI collection category and reported by Collection Services in the QAPMJOBMI file. An updated template file for QAPMJOBMI is included with QSYS with the additional fields. This template file is used only when you create QAPMJOBMI file in libraries where it does not exist. This enhancement enables improved native database versus SQL database performance isolation.
Table 6-7 lists the new columns in the QAPMJOBMI table.
Table 6-7 New columns in the QAPMJOBMI table
|
Column name
|
Description
|
|
JBNFHN
|
The identifier of a resource affinity domain that this software thread or task is associated with. A thread or task is associated with the resource affinity domain at a create time, but the operating system can decide to move it to another resource affinity domain later.
|
|
JBNFLVL
|
The resource affinity level specifies the relative strength of the binding between a thread and the internal machine resources with which it has affinity (processors and main storage). The strength is expressed as:
•X’00’ = Processor normal, main storage normal
•X’01’ = Processor normal, main storage high
•X‘10’ = Processor high, main storage normal
•X’11’ = Processor high, main storage high
•X’03’ = Processor normal, main storage none
•X’20’ = Processor low, main storage normal
|
|
JBNFGRP
|
The identifier of a resources affinity group or resource affinity domain. This identifier specifies how threads or tasks are related to other threads or tasks in their use of internal machine processing resources, or how they are related to specific resource affinity domains.
|
|
JBNFHNC
|
The amount of processor time that is used by the thread on the resource affinity domain that this thread is associated with. The time is reported in internal model-independent units. This time is called the Local Dispatch Time.
|
|
JBNFFNC
|
The amount of processor time that is used by the thread on resource affinity domains other than the one that this thread is associated with, but within the same group. The time is reported in internal model-independent units. This time is called the Non-Local Dispatch Time.
|
|
JBNFHNP
|
The number of 4-K page frames that are allocated for this thread during this interval from the resource affinity domain that this thread is associated with. These frames are called Local page frames.
|
|
JBNFFNP
|
The number of 4-K page frames that are allocated for this thread during this interval from resource affinity domains other than the one that this thread is associated with, but within the same group. These frames are called Non-local page frames.
|
|
JBTNAME
|
Identifies the name of secondary thread at sample time. The field is blank for primary threads, tasks, and unnamed secondary threads.
|
|
JBSLTCNT
|
If the short lifespan entry count is greater than zero, the entry does not represent a particular task or secondary thread. Instead, it is a special record that is used to report data that is accumulated for tasks and threads whose lifespan was shorter than the reporting threshold that was in effect when the collection started. Short lifespan tasks are reported for the processor node that they were associated with and short lifespan secondary threads are reported for the job to which they belong.
|
|
JBSACPU
|
The accumulated job scaled processor time that is charged (in microseconds). The accumulated scaled interval processor time that is charged for all threads of the job since the job started. This field is provided for primary threads only.
|
|
JBINDCPU
|
The amount of unscaled processor time (in µs) that represents the work that is done solely within this thread without regard for how server task work is charged.
|
|
JBSINDCPU
|
Thread scaled processor time that is used (in microseconds). The amount of scaled processor (in µs) time that represents the work that is done solely within this thread without regard for how server task work is charged.
|
|
JBCPUWC
|
The elapsed processor time (in µs) that a task runs.
|
|
JBVPDLY
|
The elapsed delay time (in microseconds) because virtualization for a task when it was running. The virtual processor delay time includes virtual processor thread wait event time, virtual processor thread wait ready time, and virtual processor thread dispatch latency.
|
|
JBSEIZECNT
|
The number of seizes held by this thread at the time that the data was sampled.
|
|
JBPSLCKCNT
|
The number of process scoped locks that are held by this thread at the time that the data was sampled.
|
|
JBTSLCKCNT
|
The number of thread scoped locks that are held by this thread at the time that the data was sampled.
|
|
JBTSRCDLCK
|
The number of thread scoped database record locks held by this thread at the time that the data was sampled.
|
|
JBNFOGDT
|
The amount of processor time that is used by the thread in a resource affinity group other than the one that this thread is associated with. The time is reported in internal model-dependent units.
|
|
JBNFOGMA
|
The number of 4-K page frames that are allocated for this thread during this interval from a resource affinity group other than the one that this thread is associated with.
|
|
JBFLDR2
|
Workload capping group delay time (in microseconds). The amount of time that this thread could not be dispatched because of workload capping.
|
|
JBFLDR3
|
Workload capping group. The identifier for the workload capping group that this thread belonged to at the time these data were sampled. A value of zero is reported when no group was assigned.
|
|
JBSQLCLK
|
SQL clock time. The amount of clock time (in microseconds) this thread has spent running work that was done on behalf of an SQL operation.
|
|
JBSQLCPU
|
Thread unscaled SQL CPU time used. The amount of unscaled processor time (in microseconds) this thread has used running work that was done on behalf of an SQL operation
|
|
JBSQLSCPU
|
Thread scaled SQL processor time used. The amount of scaled processor time (in microseconds) that this thread used running work that was done on behalf of an SQL operation.
|
|
JBSQLDBR
|
SQL synchronous database reads. The total number of physical synchronous database read operations that are done on behalf of an SQL operation.
|
|
JBSQLNDBR
|
SQL synchronous nondatabase reads. The total number of physical synchronous non-database read operations that are done on behalf of an SQL operation.
|
|
JBSQLDBW
|
SQL synchronous database writes. The total number of physical synchronous database write operations that are done on behalf of an SQL operation.
|
|
JBSQLNDBW
|
SQL synchronous nondatabase writes. The total number of physical synchronous non-database write operations that are done on behalf of an SQL operation.
|
|
JBSQLADBR
|
SQL asynchronous database reads. The total number of physical asynchronous database read operations that are done on behalf of an SQL operation.
|
|
JBSQLANDBR
|
SQL asynchronous nondatabase reads. The total number of physical asynchronous non-database read operations that are done on behalf of an SQL operation.
|
|
JBSQLADBW
|
SQL asynchronous database writes. The total number of physical asynchronous database write operations that are done on behalf of an SQL operation.
|
|
JBSQLANDBW
|
SQL asynchronous nondatabase writes. The total number of physical asynchronous non-database write operations that are done on behalf of an SQL operation.
|
|
JBHSQLSTMT
|
Number of high-level SQL statements. The number of high-level SQL statements that run during the Collection Services time interval. This count includes only initial invocation of the independent SQL statements. It does not include dependent SQL statements started from within another SQL statement. This count also includes initial invocation of independent SQL statements that failed to run successfully.
|
QAPMJOBSR
This file contains data for jobs that run save or restore operations. It contains one record per job for each operation type that is run.
If you click Collection Services → Collection Services Database Files, and then select QAPMJOBSR in Performance Data Investigator (PDI), you see an overview of the data that looks like Figure 6-4.
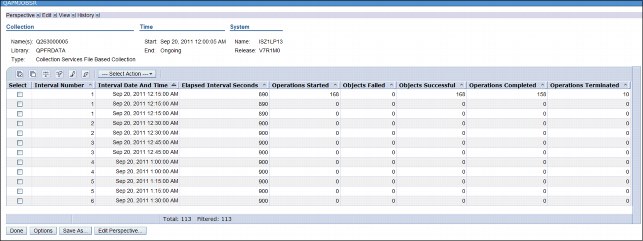
Figure 6-4 Output from the QAPMJOBSR table
QAPMSHRMP
The QAPMSHRMP table reports shared memory pool data (refer to as Active Memory Sharing in PowerVM). This data is generated only when a partition is defined to use a shared memory pool. Data is reported for both the partition's use of the pool and pool metrics that are the sum of activity that is caused by all partitions using the pool. You must have a POWER6 system and firmware level xx340_075 or later for this data to be available. See Table 6-8 for the data that is kept in this table, which shows the interval number (INTNUM), date and time (DTETIM), and the seconds in the interval (INTSEC) columns.
Table 6-8 Contents of the QAPMSHRM table
|
Column name
|
Description
|
|
SMPOOLID
|
Shared memory pool identifier. The identifier of the shared memory pool that this partition is using.
|
|
SMWEIGHT
|
Memory weight. Indicates the variable memory capacity weight that is assigned to the partition. Valid values are hex 0 - 255. The larger the value, the less likely this partition is to lose memory.
|
|
SMREALUSE
|
Physical real memory used. The amount of shared physical real memory, in bytes, that was being used by the partition memory at the sample time.
|
|
SMACCDLY
|
Real memory access delays. The number of partition processor waits that occurred because of page faults on logical real memory.
|
|
SMACCWAIT
|
Real memory access wait time. The amount of time, in milliseconds, that partition processors waited for real memory page faults to be satisfied.
|
|
SMENTIOC
|
Entitled memory capacity for I/O. The amount of memory, in bytes, assigned to the partition for usage by I/O requests.
|
|
SMMINIOC
|
Minimum entitled memory capacity for I/O. The minimum amount of entitled memory, in bytes, needed to function with the current I/O configuration.
|
|
SMOPTIOC
|
Optimal entitled memory capacity for I/O. The amount of entitled memory, in bytes, that allow the current I/O configuration to function without any I/O memory mapping delays.
|
|
SMIOCUSE
|
Current I/O memory capacity in use. The amount of I/O memory, in bytes, currently mapped by I/O requests.
|
|
SMIOCMAX
|
Maximum I/O memory capacity used. The maximum amount of I/O memory, in bytes, that was mapped by I/O requests since the partition last had an IPL or the value was reset by an explicit request.
|
|
SMIOMDLY
|
I/O memory mapping delays. The cumulative number of delays that occurred because insufficient entitled memory was available to map an I/O request since the partition last underwent an IPL.
|
|
MPACCDLY
|
Pool real memory access delays. The number of virtual partition memory page faults within the shared memory pool for all partitions.
|
|
MPACCWAIT
|
Pool real memory access wait time. The amount of time, in milliseconds, that all partitions processors spent waiting for page faults to be satisfied within the shared memory pool.
|
|
MPPHYMEM
|
Pool physical memory. The total amount of physical memory, in bytes, assigned to the shared memory pool.
|
|
MPLOGMEM
|
Pool logical memory. The summation, in bytes, of the logical real memory of all active partition active partitions that are served by the shared memory pool.
|
|
MPENTIOC
|
Pool entitled I/O memory. The summation, in bytes, of the I/O entitlement of all active partitions that are served by the shared memory pool.
|
|
MPIOCUSE
|
Pool entitled I/O memory in use. The summation, in bytes, of I/O memory that is mapped by I/O requests from all active partitions that are served by the shared memory pool.
|
QAPMSYSTEM
The QAPMSYSTEM reports system-wide performance data. In IBM i 7.1, columns are added, as shown in Table 6-9.
Table 6-9 New columns in QAPMSYSTEM
|
Column name
|
Description
|
|
SYPTWAIT
|
Virtual processor thread wait event time. The elapsed time in microseconds that blocked threads of the partition's virtual processors were waiting for an event that caused them to become ready to run.
|
|
SYPTREADY
|
Virtual processor thread wait ready time. The elapsed time in microseconds that ready to run threads of the partition's virtual processors waited to be dispatched when entitled capacity was exhausted.
|
|
SYPTLATEN
|
Virtual processor thread dispatch latency. The elapsed time in microseconds that ready to run threads of the partition's virtual processors waited to be dispatched when entitled capacity was not exhausted and a physical processor was not available.
|
|
SYPTACT
|
Virtual processor thread active time. The elapsed time in milliseconds summed for all threads of a virtual processor for the time that the virtual processor is active in the partition. A virtual processor that is active is one that is varied on; a virtual processor that is not active is either varied off or not installed.
|
|
SYPTIDLE
|
Virtual processor thread idle time. The elapsed time in milliseconds summed for all threads of a virtual processor for the time that thread is idle in the partition. A processor thread that is idle is one that is varied on and running the partition's idle loop.
|
|
SYPTINTR
|
Virtual processor thread interrupt time. The elapsed time in milliseconds summed for all threads of a virtual processor for the time that thread is handling interrupts in the partition.
|
|
SYFRMCPU
|
Processor firmware time used (in microseconds). The amount of processor firmware time that is used by this partition.
|
|
SYFRMSCPU
|
Processor scaled firmware time that is used (in microseconds). The amount of scaled processor firmware time that is used by this partition.
|
|
SYFRMSCPU
|
Processor scaled firmware time that is used (in microseconds). The amount of scaled processor firmware time that is used by this partition.
|
|
SYPFOLDSW
|
Identifies the current state of the processor folding1 switch, where:
•Blank means data not available
•“0” off
•“1” on
•“2” system controlled
|
|
SYPFOLDST
|
The current state of processor folding, where:
•Blank means data not available
•“0” disabled
•“1” enabled
|
|
SYEMMAJCDE
|
Energy management major code2.
|
|
SYEMMINCDE
|
Energy management minor codeb.
|
|
SYEMATTR
|
Energy management attributes. Bit 0 identifies the power draw limit type (0 = soft, 1 = hard).
|
|
SYEMPWRLMT
|
Energy management power draw limit in watts.
|
1 Processor folding enhances the use of the shared processor pools by minimizing the usage of idle virtual processors (VP). This configuration allows virtual partitions to be configured with more VPs to take better advantage of the shared processor pool. It does so by allowing you to increase the number of VPs on your configuration without a performance impact. It also increases the average VP dispatch cycle. This results in better cache use and reduced workload in the Hypervisor.
2 Maj 0, Min 0 = Unspecified or unavailable; Maj 0, Min 2 = Disabled (nominal performance); Maj 0, Min 1 = Enabled (maximum performance); Maj 0, Min 3 = Enabled (power saver); Maj 1, Min 0-127 = Enabled (dynamic power optimizer).
QAPMSYSWLC
This database file reports workload capping group data. Data is generated only when one or more workload capping groups were in use during the collection. A record is written for each group that is active. Table 6-10 shows the columns in QAPMSYSWLC.
Table 6-10 Columns in QAPMSYSWLC
|
Column name
|
Description
|
|
INTNUM
|
Interval number. The nth sample database interval that is based on the start time that is specified in the Create Performance Data (CRTPFRDTA) command.
|
|
DATETIME
|
Interval date and time. The date and time of the sample interval.
|
|
INTSEC
|
Elapsed interval seconds. The number of seconds since the last sample interval.
|
|
SWGROUP
|
Group ID. The identifier for the workload group.
|
|
SWGNAME
|
Group Name. The name that is assigned to the workload group when it is allocated by License Management.
|
|
SWPRCASN
|
Processors assigned. The maximum number of processors that can be used concurrently by all threads of all processes that are associated with the workload group. This value is the value that is associated with the group at the time data was sampled.
|
|
SWPRCAVL
|
Processor time available (in microseconds). The amount of processor time that this group had available to it based on the number of processors that are assigned to the group over time.
|
|
SWPRCUSE
|
Processor unscaled time used (in microseconds). The amount of unscaled processor time that is used within the threads that are assigned to this group. This value does not include the time that charged to a thread by server tasks.
|
|
SWSPRCUSE
|
Processor scaled time that is used (in microseconds). The amount of scaled processor time that is used within threads that are assigned to this group. This value does not include the time that is charged to a thread by server tasks.
|
|
SWDELAY
|
Dispatch latency time. The amount of time ready to run threads could not be dispatched because of the group's maximum concurrent processor limit.
|
|
SWPRCADD
|
Processes added. The number of process instances that became associated with this group during the interval.
|
|
SWPRCRMV
|
Processes removed. The number of process instances that were disassociated from this group during the interval.
|
QAPMTAPE
The QAPMTAPE table contains the tape device data that is collected in the Removable storage (*RMVSTG) collection category. It contains one record per interval per tape device that is connected to the system. Besides the data about the interval, it contains the columns in Table 6-11.
Table 6-11 New columns in QAPMTAPE
|
Column name
|
Description
|
|
TPRDS
|
Number of reads
|
|
TPWRTS
|
Number of writes
|
|
TPBRD
|
Bytes read
|
|
TPBWRT
|
Bytes written
|
|
TPWREQ
|
Time spent waiting for a request from the client (in milliseconds)
|
|
TPWRESP
|
Time spent waiting for a response from the drive (in milliseconds)
|
|
TPSFMCMD
|
Space by file mark commands
|
|
TPFLMRKSPC
|
File marks spaced
|
|
TPSBCMD
|
Space block commands
|
|
TPBLCKSPC
|
Blocks spaced
|
|
TPWFMCMD
|
Write file mark commands
|
|
TPFLMRKWRT
|
File marks written
|
|
TPSEODCMD
|
Space to EOD commands
|
|
TPWBCMD
|
Write buffer commands
|
|
TPRELEASES
|
Release commands
|
|
TPREWINDS
|
Tape rewinds
|
|
TPUNLOADS
|
Tape unloads
|
|
TPSTPOSCMD
|
Set tape position commands
|
|
TPRDPOSCMD
|
Read tape position commands
|
QAPMXSTGD
In IBM i 7.1, the QAPMXSTGD table, was added with performance data of external storage systems (DS8000 and DS6000 storage servers). These data can be analyzed with iDoctor - Collection Services Investigator. The table contains mainly volume and LUN-oriented statistics and can also get advanced Logsensestats from those storage servers. The support for *EXTSTG is disabled when sent. For more information, see the Memo to Users and APAR SE41825 for PTF information at:
For more information, see Chapter 8, “Storage and solid-state drives” on page 377.
QAPMSYSINT
This database file contains data for IBM support use when investigating performance on IBM POWER7 Systems™. With PTFs MF56871 and SI49418, support was added to view metrics for the TLBIE instruction on Power Systems. The data in this file varies based on the record type. Record type 3 contain the two types of TLBIE records needed to present all the data. The two types are distinguished by the SIDID field 1 and 2.
Table 6-12 shows the contents of the QAPMSYSINT table for record type 3, SIDID 1.
Table 6-12 Contents of the QAPMSYSINT table for record type 3, SIDID 1
|
Column name
|
Description
|
|
INTNUM
|
Interval number. The nth sample database interval that is based on the start time in the Create Performance Data (CRTPFRDTA) command.
|
|
DATETIME
|
Interval date (mmddyy) and time (hhmmss). The date and time of the sample interval.
|
|
INTSEC
|
Elapsed interval seconds. The number of seconds since the last sample interval.
|
|
SITYPE
|
Record type. Always 3 for the values shown in this table.
|
|
SIDID
|
Internal record identifier. Always 1 for the values shown in this table.
|
|
SIDATA01
|
Total TLBIEs
|
|
SIDATA02
|
The number of ticks of the time base special purpose register spent processing TLBIEs this interval. On POWER7, there are 512 ticks in a microsecond. Divide the value in this record by 512 to get the total time spent processing TLBIEs in microseconds.
Note: SIDATA02 / SIDATA01 = “Average TLBIE time”
|
|
SIDATA03
|
TLBIE stats start time. Not used by iDoctor.
|
|
SIDATA04
|
Total TLBIEs with a duration < 1 microsecond.
Note: On fields SIDATA04-SIDATA09, divide by 1,000,000 to get the value in millions.
|
|
SIDATA05
|
Total TLBIEs with a duration between 1 and < 10 microseconds.
|
|
SIDATA06
|
Total TLBIEs with a duration between 10 and < 1000 microseconds.
|
|
SIDATA07
|
Total TLBIEs with a duration between 1 and < 10 milliseconds.
|
|
SIDATA08
|
Total TLBIEs with a duration between 10 and < 100 milliseconds.
|
|
SIDATA09
|
Total TLBIEs with a duration > 100 milliseconds.
|
|
SIDATA10
|
Average time that is spent processing TLBIEs (in ticks) in the last 10 milliseconds. Divide by 512 to get this value in microseconds.
|
|
SIDATA11
|
Average time that is spent processing TLBIEs (in ticks) in the last 100 milliseconds. Divide by 512 to get this value in microseconds.
|
|
SIDATA12
|
Average time that is spent processing TLBIEs (in ticks) in the last 1 second. Divide by 512 to get this value in microseconds.
|
|
SIDATA13
|
Average time that is spent processing TLBIEs (in ticks) in the last 10 seconds. Divide by 512 to get this value in microseconds.
|
|
SIDATA14
|
Average time that is spent processing TLBIEs (in ticks) in the last 100 seconds. Divide by 512 to get this value in microseconds.
|
|
SIDATA15
|
Average time that is spent processing TLBIEs (in ticks) in the last 1000 seconds. Divide by 512 to get this value in microseconds.
|
Table 6-13 shows the contents of the QAPMSYSINT table for record type 3, SIDID 2.
Table 6-13 Contents of the QAPMSYSINT table for record type 3, SIDID 2
|
Column name
|
Description
|
|
INTNUM
|
Interval number. The nth sample database interval that is based on the start time in the Create Performance Data (CRTPFRDTA) command.
|
|
DATETIME
|
Interval date (mmddyy) and time (hhmmss). The date and time of the sample interval.
|
|
INTSEC
|
Elapsed interval seconds. The number of seconds since the last sample interval.
|
|
SITYPE
|
Record type. Always 3 for the values that are shown in this table.
|
|
SIDID
|
Internal record identifier. Always 2 for the values that are shown in this table.
|
|
SIDATA01
|
Total add HPTE requests.
|
|
SIDATA02
|
Total remove HPTE requests.
|
|
SIDATA03
|
Total set HPTE change bit requests.
|
|
SIDATA04
|
Total set HPTE storage key requests.
|
|
SIDATA05
|
Total set address compare bit requests.
|
|
SIDATA06
|
Total set HPTE page protect bit requests.
|
|
SIDATA07
|
Total get HPTE status bit requests.
|
|
SIDATA08
|
Total set HPTE reference bit requests.
|
|
SIDATA09
|
Current interval start time (not used by iDoctor.)
|
|
SIDATA10
|
Maximum paced spin wait time. Divide by 512 to get this value in microseconds.
|
|
SIDATA11
|
Total paced spin wait time. Divide by 512 to get this value in microseconds.
Note: SIDATA11 / SIDATA12 = “Average paced spin wait time”
|
|
SIDATA12
|
Total paced spin waits TLBIEs.
|
|
SIDATA13
|
Maximum paced time. Divide by 512 to get this value in microseconds.
|
|
SIDATA14
|
Total paced time. Divide by 512 to get this value in microseconds.
|
|
SIDATA15
|
Total paced TLBIEs.
Note: SIDATA14 / SIDATA15 = “Average paced TLBIE time”
|
6.3 IBM Navigator for i Performance Data Investigator
Several enhancements were made to Performance Data Investigator (PDI), which can be accessed by selecting the Investigate Data task:
•Integration with Database
•Performance Reports
•Collections List Changes
•Drilldown Information now provided
•Job Watcher – Display Holder Information
•Show SQL Error Messages Option for ModifySQL
•System Information window available for CS
•Added Java Perspectives
•Workload Group Perspectives
•Timeline Overview Perspective
•Memory Perspectives
|
Important: Major enhancements have been made to IBM Navigator for i and the Performance Data Investigator, so ensure that you have the latest group PTFs installed for the following groups:
•HTTP Server group, PTF SF99368
•Java group, PTF SF99572
•Database group, PTF SF99701
•Performance Tools group, PTF SF99145
|
For a full overview of all the functions of the Performance Investigator and Collection management interface, see Chapter 17, “IBM Navigator for i 7.1” on page 671.
Authority to the database files and members used in Performance Data Investigator
The user profile that performs work with the database files and members for PDI requires a specific level of object authority. See the following website for details:
6.4 IBM iDoctor for IBM i
This section describes the changes in IBM iDoctor for IBM i in IBM i 7.1:
•Investigator is now available for version 7.1 and version 6.1.
•Heap Analyzer is not available for 7.1.
•VIOS Investigator is a new component that uses NMON data to analyze VIOS performance using the power of the DB2 database on IBM i. This component is available for version 6.1 and version 7.1.
•HMC Walker is a new component that allows a user to monitor all LPARs and physical systems that are attached to their HMC. This provides configuration and high-level metrics from the HMC that can be used to drill down into the LPARs for more detail.
•The MustGather Tools component is now available. This component is designed to help with data collection during problem analysis.
•A new no additional cost FTP client component is now part of iDoctor. From the connection view, you can choose the connection type (IBM i) or FTP. If you have an IBM i connection and want to try the FTP support, right-click and use the Start FTP session menu. For IBM i FTP support, you have access to both the IFS and libraries. You can download, upload, or cause a transfer of the selected files to another system.
For more information about IBM iDoctor for IBM i, see Appendix A, “IBM i Doctor for IBM i” on page 865.
..................Content has been hidden....................
You can't read the all page of ebook, please click here login for view all page.