
APPENDIX C
How to Compile a Unique Financial Database of More than 20,000 Annual Reports
As stated, this book focuses on digital transformation value implications for established capital market listed firms with a sufficient history to require a transformation from a given digital status‐quo to a more advanced digital outcome. Consequently, greenfield companies are not in scope. To achieve similar goals, related work has first typically included a broad variety of listed company portfolios, ranging from global surveys (Westerman, Bonnet, and McAfee 2014), to various US companies (Beutel 2018; Chen and Srinivasan 2019) and exclusively Europe‐centric approaches (Hossnofsky and Junge 2019; Kawohl and Hüpel 2018; Wroblewski 2018). Second, the authors applied divergent data sources (COMPUSTAT, CRSP, IBES, Thomson Reuters DataStream and annual reports) for financial analysis. Therefore, clear choices were required for these two key research foundations.
Different global stock indexes have carefully been considered to construct the final listed large corporate portfolio for analysis. In the end, after a cautious assessment—the NASDAQ and the New York Stock Exchange (NYSE)—two US‐based regional stock exchanges for large corporates turned out to be the best‐fitting choice. They were found to provide a good match across all data requirements. First, due to the focus on US‐listed companies, geographical market context differences are of less relevance for the planned valuation approach. Second, the chosen companies, due to their listing in the United States, provide a sufficient data history, guaranteed quality, and consistency based on the conservatism in applicable US‐GAAP accounting rules. This further supports a good fit to the assumptions required for the later applied clean‐surplus‐based valuation models (Falkum 2011). Finally, they provide a sufficiently broad industry and sector coverage for better generalizability of all findings. Obviously, depending on the availability of datapoints for each analysis, regressions will only use a limited part of these observations (see Table C.1). For example, because of leveraging the lagged ROA (L1ROA) for our models, the number of observations naturally must go down closer to the 20K range.
The portfolio has yearly on average shown market capitalization (avgMARKETCAP) growth, the expected COVID19 dip in 2020 and fluctuating negative mid‐term ROA performance (ROA3Y) over the full period as can be seen in Figures C.1 and C.2.
I spare you the required endless tables here, but rest assured that the final dataset is adequately balanced across sectors and industries, covering eight sectors, 31 industry categories, and 206 industry groups. This is true when reviewing all observations from the dataset as well as when assessing only the relevant data subset for financial analysis, that is, after removing all observations eliminated due to missing financial data in the final analysis.
From day one of starting the research, the vision was to develop a harmonized and single “source of truth” including a solution for the difficult timing congruence of textual and financial information and the ability to correctly match these two elements. The aim was to create a unique data source never before available for digital transformation research. After looking into different automated and manual data sourcing options applied in literature (Beutel 2018; Chen and Srinivasan 2019; Kawohl and Hüpel 2018; Hossnofsky and Junge 2019; Cohen, Malloy, and Nguyen 2020), it became clear that getting data as close as possible from its source would be most efficient for the planned advanced analysis. Fortunately, the US Securities and Exchange Commission's (SEC's) HTTPS file system allows scraping the “Electronic Data Gathering, Analysis, and Retrieval system” (EDGAR) filings by corporations, funds, and individuals. “EDGAR indexes list all public SEC filings for each quarter starting in the third quarter of 1994 to the present” (SEC 2020a). Scraping data directly from EDGAR provided three clear benefits. First and foremost, all relevant companies were addressable, with reduced need to exclude companies for data availability reasons. Second, EDGAR provided electronic accessibility via flexible APIs including the option to export full text and not just PDFs in a unified structure and content classification across all reports. Third, matching market, value and other complementary financial data could be sourced from one specialized financial information data source: Intrineo. Intrineo data feed also directly builds on EDGAR, reaches back until 2007 and has relevant data for this research purpose from 2009 (Intrinio 2020) as further laid out later.
TABLE C.1 Overall sample financial summary statistics.
| Financial variables | N | Mean | SD | Min | Max |
|---|---|---|---|---|---|
| MARKETCAP | 27522 | 1.64E+10 | 1.11E+12 | ‐2.38E+11 | 1.82E+14 |
| ROA3Y | 20997 | ‐0.0582299 | 0.927666 | ‐53.67982 | 13.17412 |
| TOTAL EQUITY | 29886 | 2.76E+09 | 1.22E+10 | ‐1.83E+10 | 3.10E+11 |
| NET INCOME | 30064 | 3.47E+08 | 1.95E+09 | ‐2.72E+10 | 5.95E+10 |
| AOCI | 30544 | ‐1.60E+08 | 1.26E+09 | ‐5.00E+10 | 1.81E+10 |
| PAYMENT OF DIVIDENDS | 30544 | ‐1.67E+08 | 8.49E+08 | ‐6.67E+10 | 4.54E+09 |
| DELTA EQUITY | 30544 | 2.80E+07 | 5.00E+08 | 0 | 3.07E+10 |
| L1ROA | 24942 | ‐1.076136 | 159.0729 | ‐25120 | 190.8323 |
| NET DEBT | 29931 | 1.19E+09 | 1.53E+10 | ‐4.97E+11 | 5.61E+11 |
| INVESTED CAPITAL GROWTH | 28152 | 130.0668 | 10427.98 | ‐15714.08 | 1182771 |
| BOOK TO MARKET | 26948 | 6.188369 | 534.8125 | ‐4918.638 | 82220.16 |
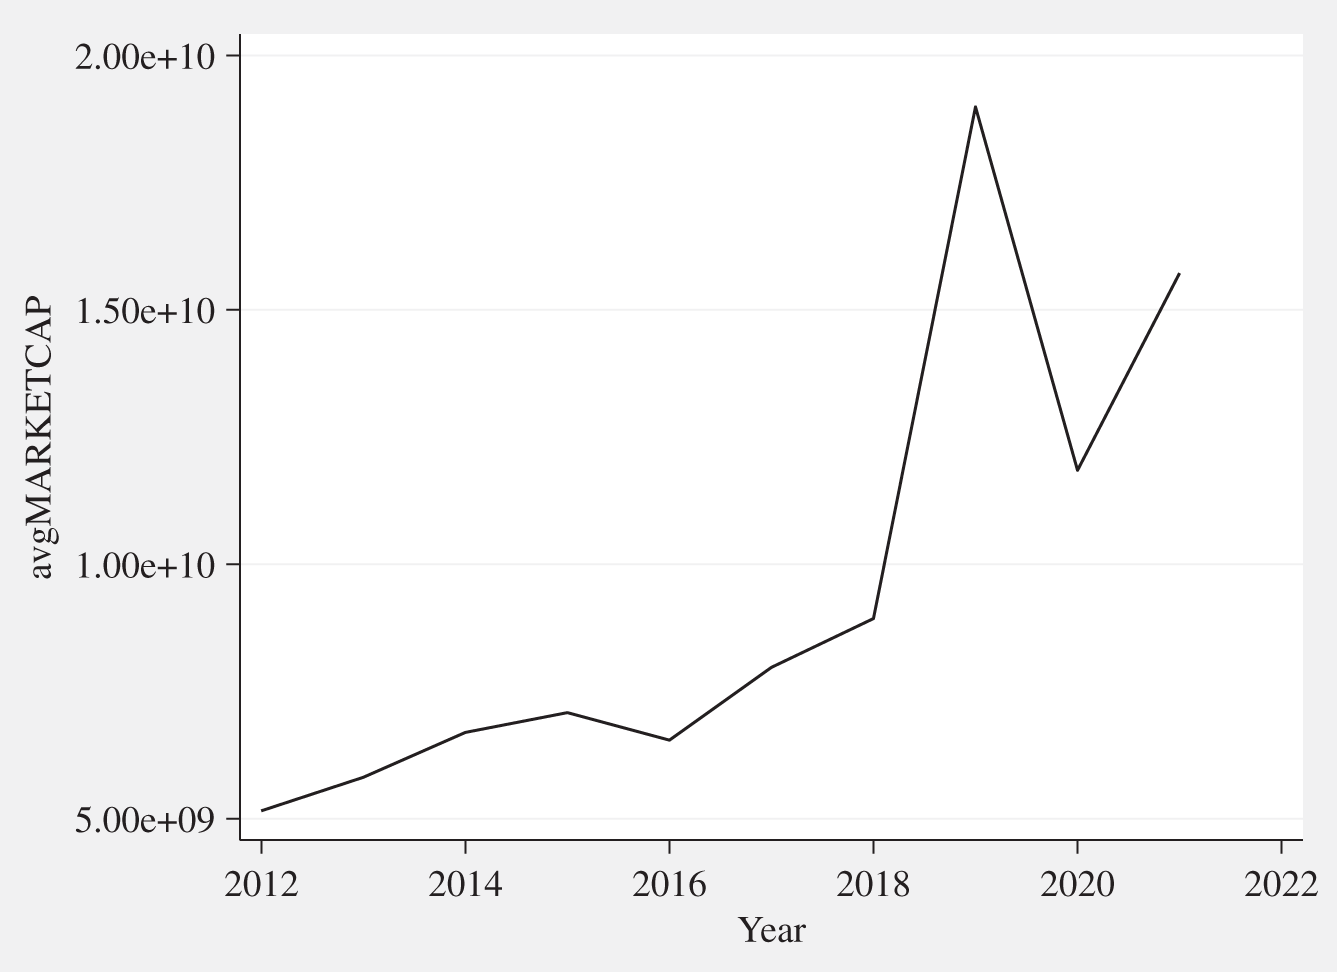
FIGURE C.1 Portfolio average market capitalization 2012–2021 (in USD).
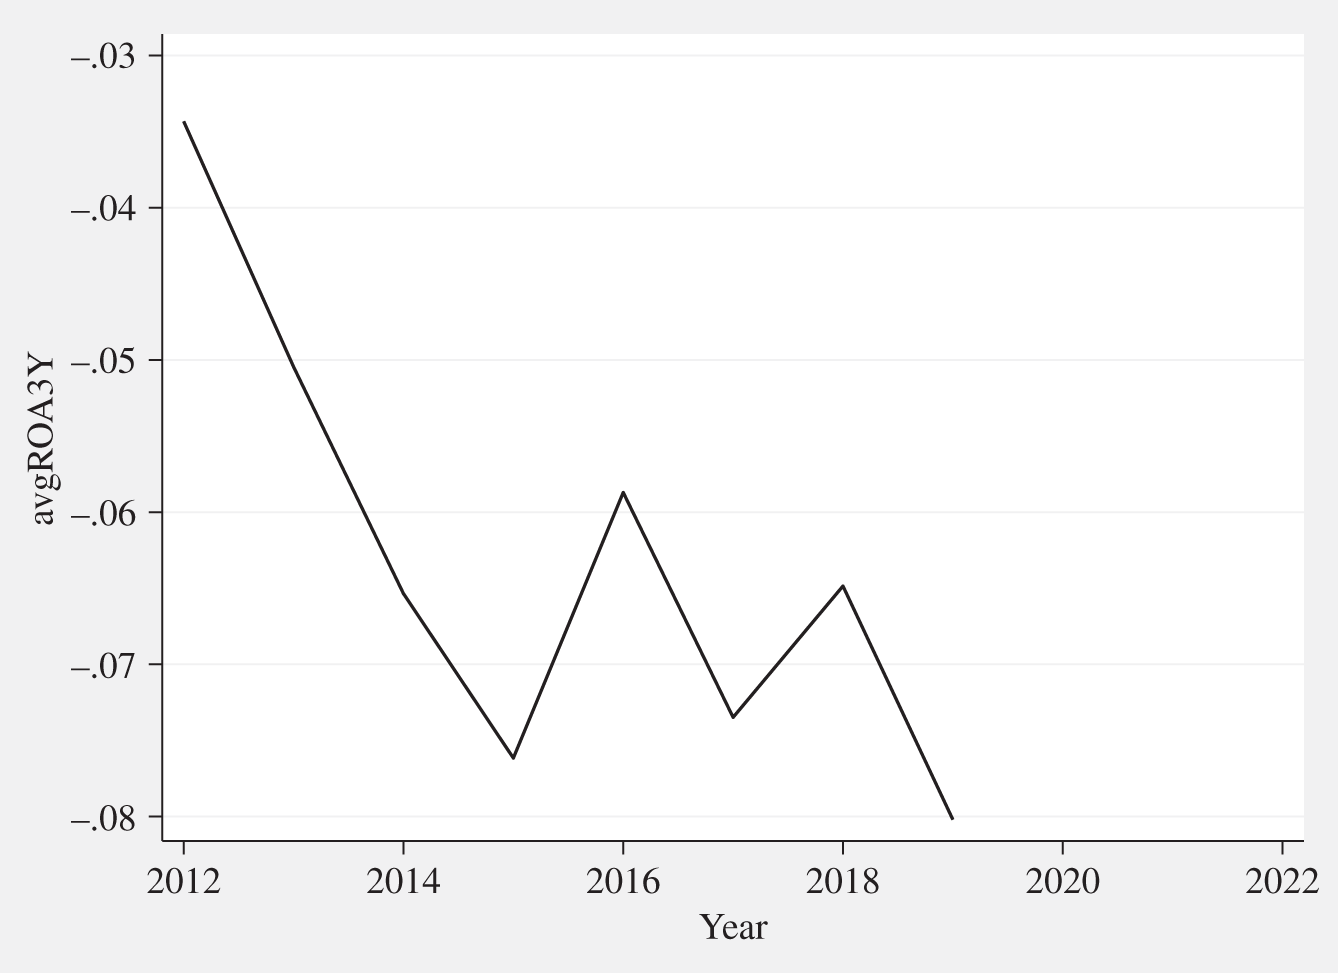
FIGURE C.2 Portfolio average ROA3Y 2011–2021 (in percent).
Out of the substantial range of reports available per company (SEC 2020b), only the overall “bulk” content of standardized annual filings (10‐K, 10‐K405 and the 10‐KSB, which is irrelevant here) was assumed to contain relevant information. This is fully in line with conceptually comparable textual analysis work (Cohen, Malloy, and Nguyen 2020) plus its underlying foundational work (Loughran and McDonald 2011). As in this research, information was further processed in a first stage by removing “clutter” (numerical tables with > 15% of numerical characters, HTML tags, newlines, XBRL tables and Unicode text) to produce a “raw” form of all reports. Underlying chapter structures of the processed reports were therefore deemed irrelevant for all further analysis. As mentioned earlier, the applied portfolio list was frozen at a fixed cut‐off date, end of June 2021, to compile the final portfolio. A custom developed Python (Python 2020) code then scraped all corresponding 10‐K/10‐K405 filings for each filing date, going back in time as far as possible for the respective companies or 2011, whichever was later.
SEC has published clear rules for submission (SEC 2020c). Originally, all companies had to submit their 10‐Ks within 90 days after the fiscal year ended. This was changed in 2004, when the SEC approved a new rule that adjusted this target to 60 days for so‐called “accelerated filers.” These companies must fulfill four criteria. First, they have market capitalization of minimum USD 75 million. Second, they have been obliged to report for a minimum of 12 months. Third, they have to upload at least one report. Finally, they are not allowed to submit their reports on Forms 10‐QSB and 10‐KSB. A further category of “large accelerated filers,” with a public float of more than USD 700 million with a deadline of 60 days and a revised final date for “accelerated filers” of 75 days was created later. 10‐Q reports, however, are due 45 days after the quarter‐end for “nonaccelerated” filers and 40 days after the quarter‐end for “accelerated” and “large accelerated” filers (SEC 2020c). This information is relevant for the following valuation analysis insofar as the understanding of potentially significant timing lags after closing and until filing have been implemented as a control, depending on actual information leakage in the meantime (earnings calls). All firms assessed conceptually fall under the “accelerated filer” and “large accelerated filer” categories, which helps pragmatically matching textual and financial data due to a limited time window for reporting.
The specialized financial information platform Intrineo serves as the predominant data source for market, value, and other complementary financial data in this research. This source differs from the more classical data originations typically applied in scientific research (mostly COMPUSTAT, CRSP, IBES, Thomson Reuters DataStream and original annual reports). Intrinio data feed was explicitly chosen because it is largely based on the same SEC EDGAR filings and therefore is consistent with the directly scraped textual EDGAR data (Intrinio 2020). It can serve as the backbone for all market and financial information over a period of 10 years. The combination of direct EDGAR scraping and the Intrinio platform therefore allowed devising the unique empirical approach at the core of this research project. Intrinio data is both accessible as bulk download and via advanced API. The major advantage of the chosen data sourcing approach is the limited need of adding additional data sources. The only exception is yahoo!finance (yahoo 2020), which is only and exclusively used to capture earnings announcements dates to later control for the time lag between these announcements and the official filing of financial information to the SEC database, but it needs to be interpreted with great care due to suspected issues in the data quality delivered with a number of outliers.
Overall, the described customized portfolio of established listed large corporations and the combination of consistent data sources—namely, SEC's EDGAR database for textual data and the Intrinio platform for most financial data—have proven to be the best fit for the major research requirement: a reliable and cross‐industry representative data set for analyzing the value impact of digital transformation on larger corporations.