
CHAPTER 15
Predictor Communications: It Is About What You Sing and How You Sing to Influence Your Payday
This book and the underlying research emphasize analyzing what companies say about their digital transformation as the best yet available proxy for their true digital transformation status. For this we have heavily built on our proxy variable DIGITALPROXY, which measures what companies say about their digital transformation by counting what we have called replicable references in the annual reports. More information on how companies say what they say about their digital transformation (how they sing their digital transformation song) has so far only been in the form of sentiment controls for POLARITY and SUBJECTIVITY. They both showed positive and significant correlations to logMARKETCAP and logROA3Y.
But with all the analytical opportunities our nonparametric model offers, there are additional interesting questions we can ask:
- Which sentiment elasticities can be implied from the analysis on financial parameters based on our historical dataset?
- Can we go even further in somehow understanding the level of concreteness of what is being said, that is, what we call quantification‐level elasticities?
For the sentiment elasticity case, we just rerun the same analysis (see Appendix F) as for our financials for POLARITY and SUBJECTIVITY.
For the quantification‐level elasticity case, things are a little more complex. A more sophisticated dependency analysis was conducted for all digital transformation dictionary hits in the analyzed reports (see Appendix D). This investigation simply uses recent natural language processing advancements, a so‐called dependency parser, to search for close syntax‐based dependencies of the DIGITALPROXY hits to either date or monetary terms, and it brings these into a percentage relation to DIGITALPROXY. In other words, it measures: to what share were the DIGITALPROXYs found and further specified by dates (e.g., “We will implement Robotic Process Automation by January 2021”) or values (e.g., “Our cloud migration program will lead to savings of 10m USD”). To simplify the scope of analysis for this book, out of the three conceptual measurement levels originally developed to describe concreteness in the original research, only the two measurements with a close syntax dependency relationship (less than five syntax arcs; see Appendix D) were used (D_CLOSE_D and D_CLOSE_M).
TABLE 15.1 Orthoforest‐based communications elasticity impact.
| Textual Variable/Characteristic | Below Zero | Around Zero | Above Zero | Way Above Zero |
|---|---|---|---|---|
| POLARITY | Negative* | Positive** | ||
| SUBJECTIVITY | Inconclusive* | Negative** | ||
| D_CLOSE_M | Inconclusive* | Inconclusive* | Inconclusive* | |
| D_CLOSE_D | Inconclusive* | Inconclusive* | Positive |
= Tight confidence interval (very certain)
** = Medium confidence interval
* = Wide confidence interval
= Very wide confidence interval (very uncertain)
Empty = not applicable
As these variables were not part of our main models for the book (mainly because in the basic main model, they were far from statistically significant with very high p‐values >0.2), they were experimentally added in a separate step to form a new fully nonparametric model now including D_CLOSE_D and D_CLOSE_M. This model was then run for elasticities the same way as before.
Table 15.1 summarizes all results in the same format as in the previous chapter for financials. Detailed graphical outputs of the identified elasticities are discussed in more detail for both analysis categories thereafter.
Sentiment Elasticity Details: “Always Look at the Bright Side of Life” (Monty Python)
For our polarity measurement (POLARITY): If the general sentiment in your communication is not at the higher (bright side) end of the overall range identified, even an intensified digital transformation communication potentially faces tough times to turn the tide of a more negative (dark side) sentiment context for your firm overall. Technically, this indication can be derived from the fact that the mean expectation in our dataset, even for slightly positive polarities, is negative with medium confidence intervals (uncertainty) and only turns positive and into tighter but not very tight confidence intervals (less uncertainty) for higher polarities, as Figure 15.1 demonstrates.
For our subjectivity sentiment on the other hand (SUBJECTIVITY) we see … that we do not see that much. Still, one could at least be tempted to conclude that at the upper range of subjective report contexts, the positive elasticity of pushing your digital transformation suddenly evaporates. This would also fit very nicely to our business intuition that investors appreciate objectivity and, at some breaking point of overly subjective communication, lose their trust. Technically, as demonstrated in Figure 15.2, this indication can be derived from the fact that the mean expectation, even for high subjectivities (in this case above around 0.4), suddenly drops below zero and with simultaneously tighter confidence intervals, signaling higher certainty. For the subjectivity values below that range, the empirical data is not really allowing any clear conclusions.
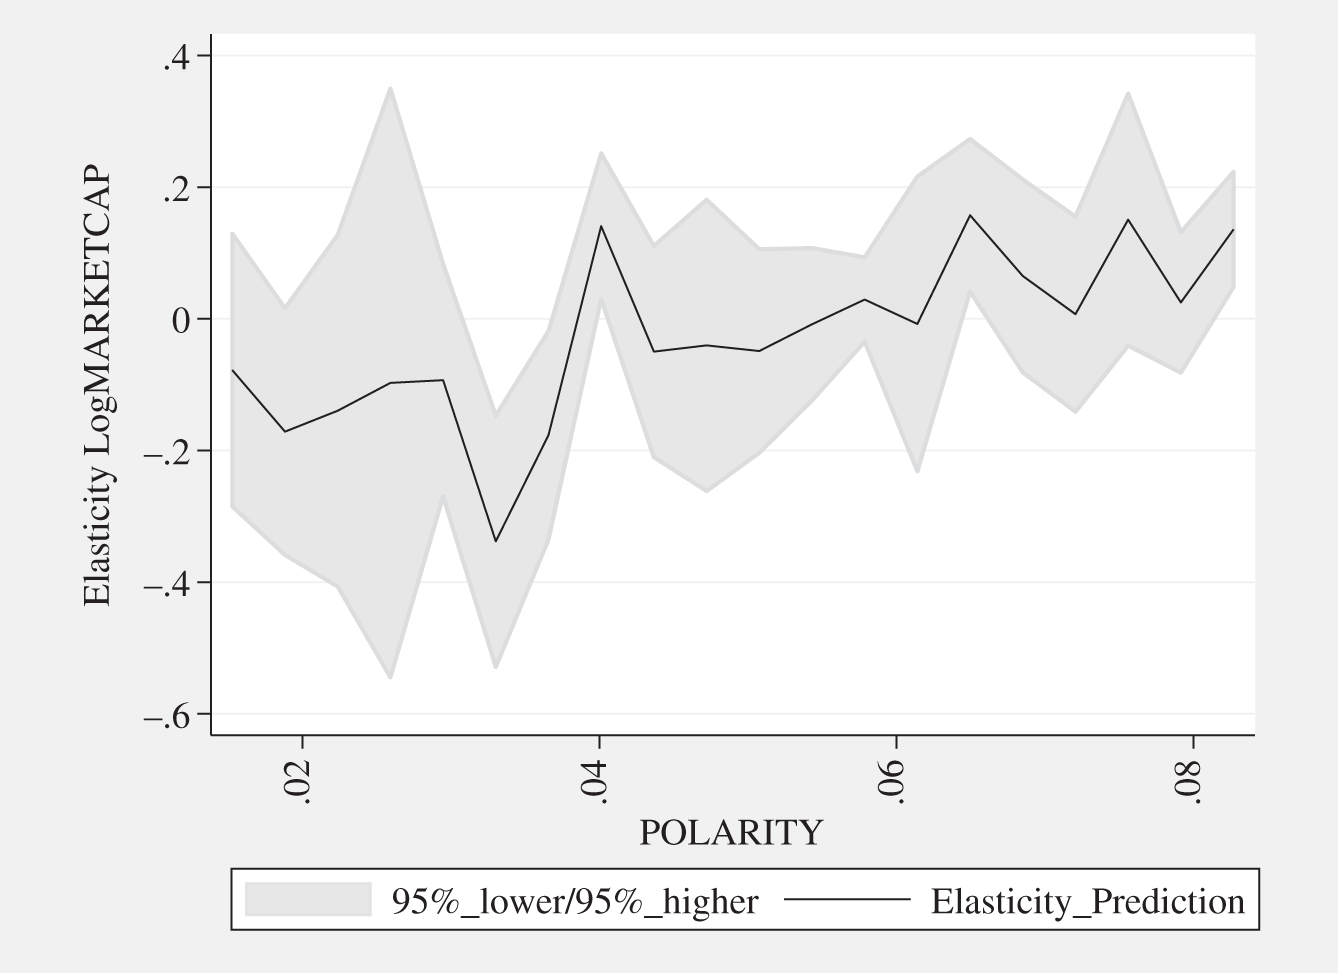
FIGURE 15.1 DIGITALPROXY elasticity POLARITY.

FIGURE 15.2 DIGITALPROXY elasticity SUBJECTIVITY.
Quantification‐Level Elasticity Details: “Money for Nothing” (Dire Straits) or “One Moment In Time” (Whitney Houston)?
For both, the quantification‐level measurement based on monetary terms (D_CLOSE_M) and the quantification‐level measurement based on date terms (D_CLOSE_D), results are much less conclusive than what one would have hoped for. Not only does the mean effect of DIGITALPROXY drop below zero when we add these two, the elasticity curves produce very few insights we can further build on. While this should certainly be groundwork for further research, for the sake of our book, we can only conclude the following, as shown in Figures 15.3 and 15.4:
- At least based on our data, the share of monetary terms, other than what intuition would tell, does not give you any indication one way or the other that elasticities are fluctuating around plus/minus zero with a medium certainty based on the confidence intervals. So money can really be for nothing.
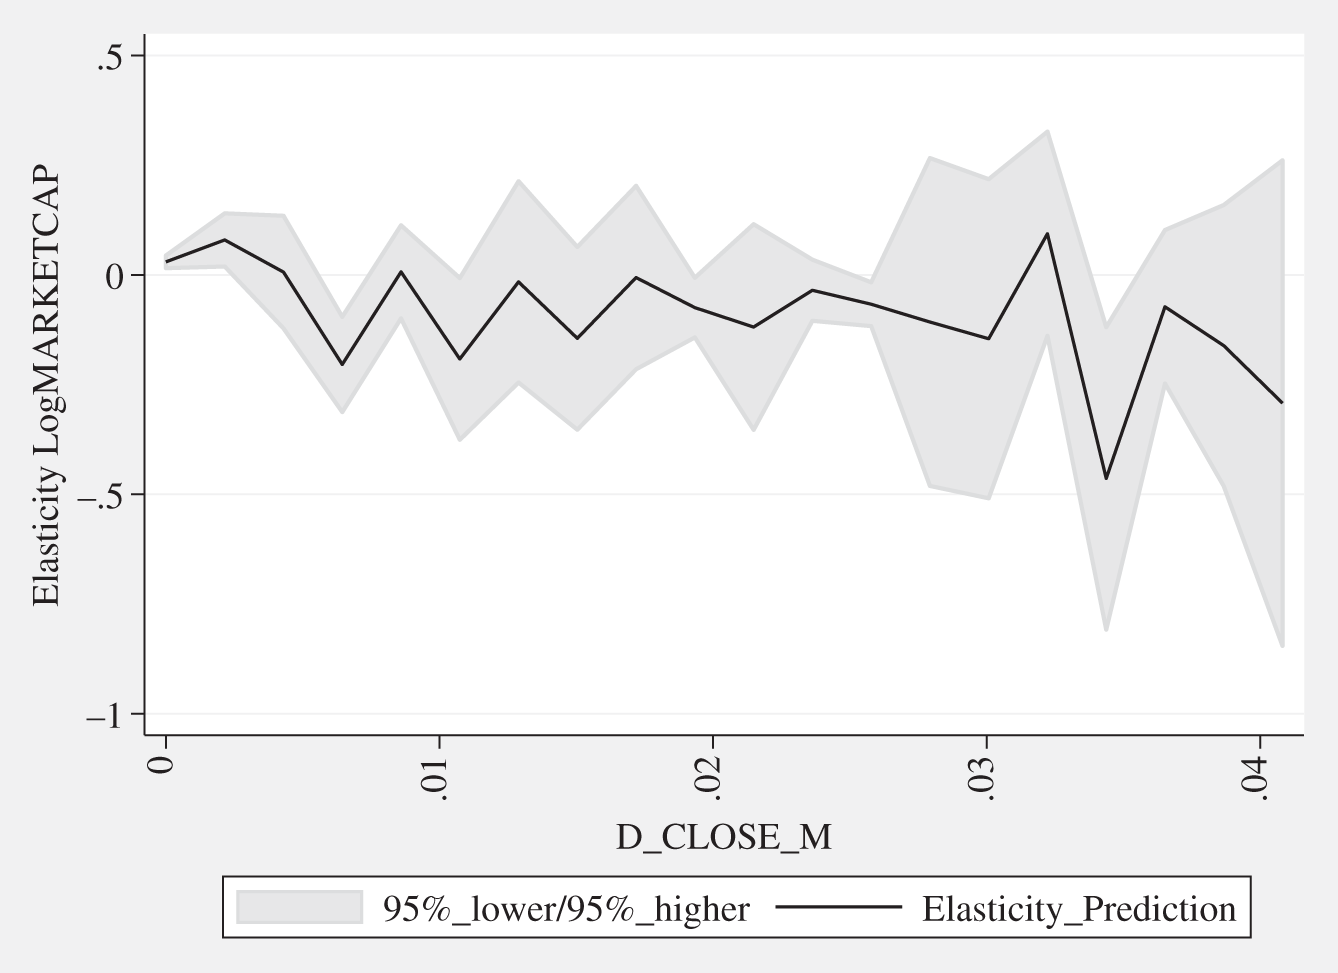
FIGURE 15.3 Quantification‐level elasticities (monetary terms).
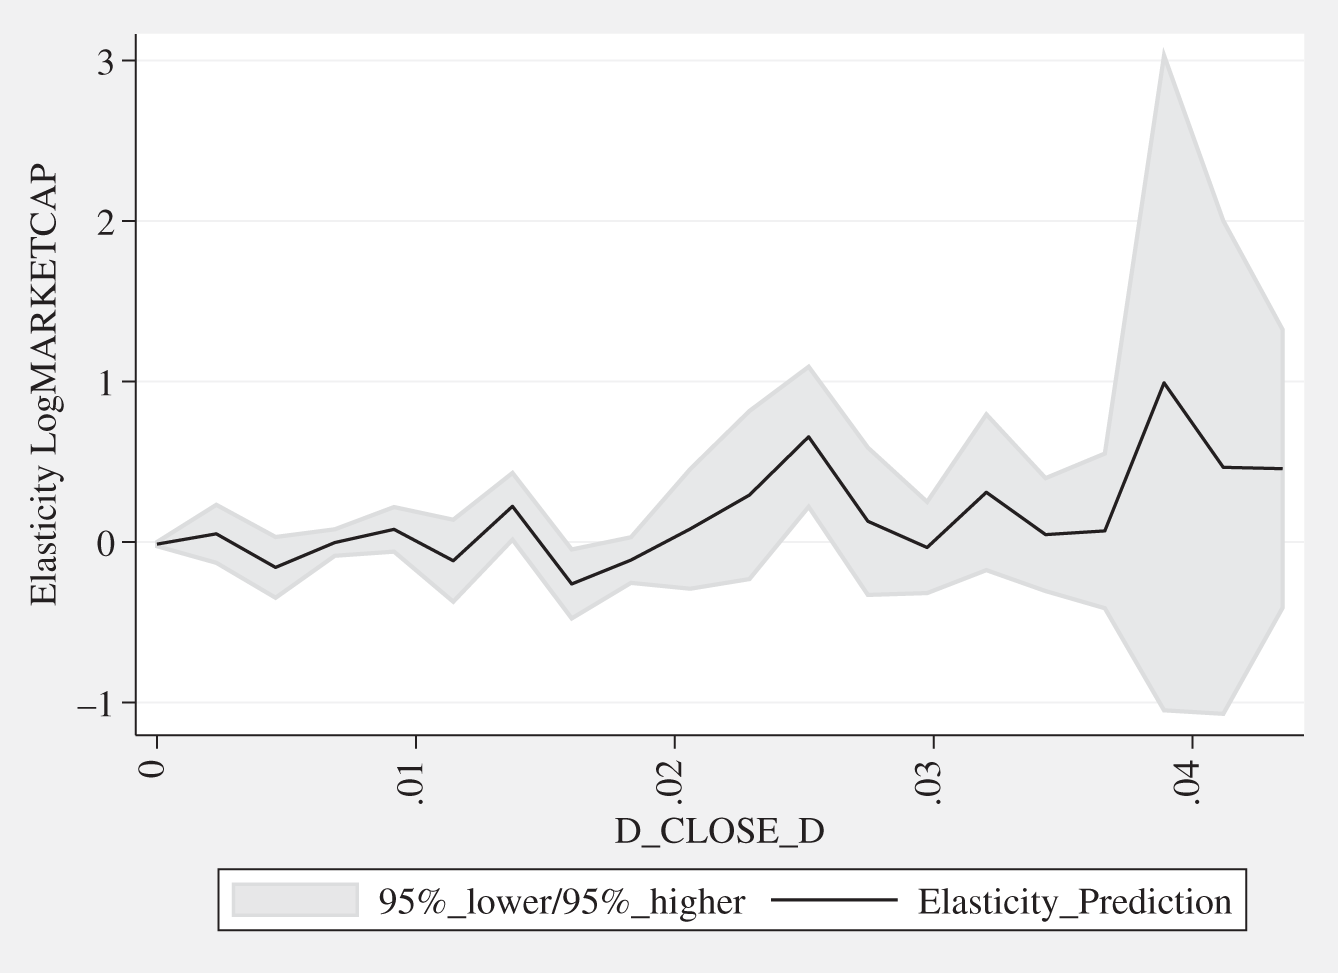
FIGURE 15.4 Quantification‐level elasticities (date terms).
- The share of date (timing‐related) terms in our data, other than what intuition would tell, does not give you any indication one way or the other that elasticities are fluctuating around plus/minus zero with a medium certainty based on the confidence intervals. Here, this at least changes for the upper range of date shares with a positive mean impact, but then with a substantial increase of uncertainty as exemplified by wide confidence intervals. So the moment in time is not totally futile.