Chapter 2
The Data Science Pipeline
Contrary to what many people think, the whole process of turning data into insights and data products is not at all straight-forward. In fact, it’s more of an iterative process, with impromptu loops and unexpected situations causing delays and reevaluations of your assumptions. That’s why we often talk about the data science pipeline, a complex process comprised of a number of inter-dependent steps, each bringing us closer to the end result, be it a set of insights to hand off to our manager or client, or a data product for our end-user. This whole process is organized in three general stages: data engineering, data modeling, and information distillation (this last one is a term coined by me). Each of these stages includes a number of steps, as you can see in this diagram:
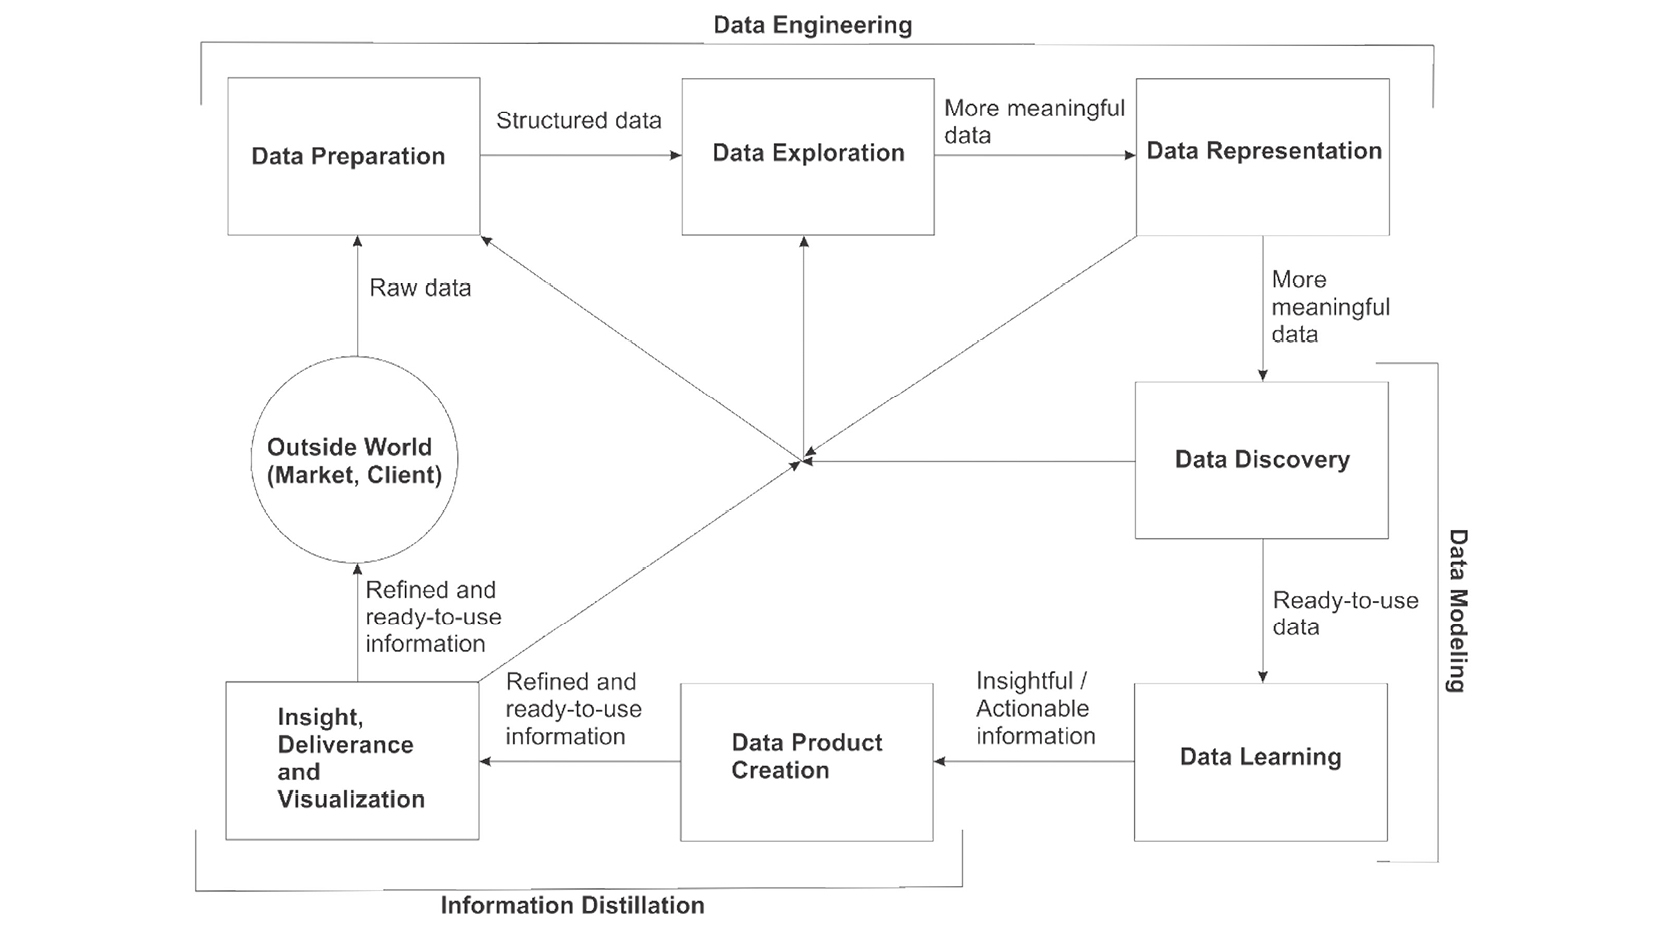
Note that the approach to the data science pipeline described here is just one possible way of viewing it. There are other representations, all of which are equally valid. Also, as the field matures, it may change to adapt to the requirements of the data scientist’s role. Keep an open mind when it comes to the data science pipeline, because it is not set in stone.
Now let’s look at each one of these steps in more detail.
Data Engineering
Data engineering involves getting your data ready for data analytics work. However, this is not an easy task because data comes in many varieties and degrees of data quality and documentation. In fact, this is the most time-consuming stage of the process, and it’s not uncommon for a data scientist to spend 70-80% of their time in this stage.
The main challenge is that most of the data streams involved in a data science project are unstructured or semi-structured data. However, most data analytics models work with structured data (aka datasets), so the raw data streams are practically useless for them. Yet, even if they are structured enough to work, most likely they won’t produce sufficiently good results because they are unrefined. The process of refining the data so that they can be of use for modeling is also part of data engineering. In general, this stage involves the following steps:
- Data preparation
- Data exploration
- Data representation
Some people consider data acquisition as part of the process, though nowadays it’s so straightforward and automated that it’s not worth describing in detail here. Most of the data acquired for a data science project comes from databases (through some query language, like SQL) or from an API.
One thing to note is that even though the aforementioned steps are executed in that order, it is often the case that we need to go back to a previous step and redo it. This iteration in the data science process is quite common in most projects and often involves back-steps from other stages of the pipeline. Let’s look at each one of these steps in more detail.
Data Preparation
Data preparation involves cleaning the data and putting it in a data file that can be used for some preliminary analysis. The objective of this step is to get the data ready for exploration, by removing or smoothing out any outliers it may have, normalizing it if necessary, and putting it in a data structure that lends itself for some descriptive analytics. One of the most common such data structures is the data frame, which is the equivalent of a database table.
Data frames have been around for a while and are widely used in data science due to their intuitiveness. It is a very popular data structure in R, Python, Julia, and other programming platforms (even Spark has its variant of data frames). In general, data frames allow for:
- Easy reference of variables by their name
- Easy handling of missing values (usually referred to as NA’s or NaN’s)
- Variety in the data types stored in them (you can have integers, strings, floats, and other data types in the same data frame, something impossible in matrix and array data structures)
So, loading your data into a data frame is usually a good first step. Of course, depending on the complexity of the problem, you may need to use several data frames and combine them afterwards.
What’s important at the data preparation stage is to get it all in one place and put it into a form to play and see what kind of signals are there, if any at all. Whatever the case, you can’t be sure about the value of the data without going through the data exploration stage that follows.
Data Exploration
Data exploration is the most interesting part of the pipeline, as it entails playing around with the data without any concrete expectations in order to understand it and find out how to best work with it. This is done primarily by creating a variety of plots. Data exploration is a serious endeavor too, as it involves a lot of quantitative analysis using statistics, particularly descriptive statistics.
Just like in every viable creative endeavor, data exploration involves a combination of intuition and logic; whatever ideas you get by looking at the various plots you create must be analyzed and tested. Several statistical tests come in handy for this, yet data exploration may also involve heuristics designed specifically for this purpose. (More on heuristics in Chapter 11.) If you have heard about stats being the cornerstone of data exploration by some boot-camp instructor, you may want to rethink it. Data science is much more than statistical analysis, even if it involves using statistics to some extent.
At the end of this stage, you should be able to have a sense of what signals the data contains, how strong these signals are, what features are best suited as predictors (if you are dealing with a predictive analytics problem), and what other features you may want to construct using the original feature set. If you have done all this, going to the next step of the data engineering stage will come naturally and without hesitation.
Data Representation
Data representation is about getting the data in the most appropriate data structures (particularly data types) and optimizing the resources used for storing and processing it in the steps that follow. Because even though the data types used to store the variables in the first step of the process may make sense, they may not be the best ones out there for this data. The understanding you have gained from the data exploration step should help you decide on whether the structures should change. Also, you may need to create a few additional features based on the original ones. The data types of these new features’ also need to be sorted out at this point.
By the term features, we mean data that is in a form that can be used in a model. Features are not the same as variables. In data science, we distinguish between the two based on the processing that has been done on them. Also, a variable may be in the dataset but not be usable in the model as-is.
The transformation from variable to feature can be straight-forward or not, depending on the data. If the data is messy, you may need to work on it before turning the variable into a feature. Whatever the case, after the data representation step, you’ll have a set of features at your disposal and have some idea of what each one of them is worth in terms of information content.
Some data science practitioners don’t give this step enough attention, because it is often perceived as part of the data preparation or the data exploration phase. However, if you talk to any computer scientist out there, they will tell you that it is very important to choose the right data type for your variables since it can make the difference between having a dataset that’s scalable and one that is not. Regardless of the computing power you have access to, you always want to go for a data structure that is more economical in terms of resources, especially if you are planning to populate it with more and more data in the future. This is because such a data structure is more future-proof, while it can also save you a lot of money in cloud resources being utilized. Statisticians may not have to worry about this matter because they usually deal with small or medium data, but in data science, scalability to the big data domain is something that must be kept in mind, even if the data we have at the moment is manageable. Proper data representation can ensure that.
Data Modeling
The data modeling stage is by far the most essential of all three stages of the data science pipeline. This is where the data you have meticulously prepared in the previous stages is turned into something more useful, namely a prediction of or valuable insight. Contrary to what many teach, data modeling is more than just taking functions from a specialized package and feeding it data. It involves much more, probably enough to cover a whole semester’s worth of classes. Everyone can import a package and use it, given they are patient enough to read the corresponding documentation. If you want to do data modeling properly, however, you need to go beyond that. Namely, you need to experiment with a number of models (the more diverse, the better), manage a robust sampling process, and then evaluate each one of these experiments with a few performance metrics.
Afterwards, you may want to combine some of these models, and do another set of experiments. This will not only enable your aggregate model to have a better performance, but also help you delve deeper into the nature of the problem and figure out potential subtleties that you can use to make it better.
Before you even get started with the models, evaluate the features themselves and perhaps do some preliminary analysis on them, followed by some preprocessing. This may involve the generation of meta-features, a process that is common in complex datasets. These two main steps in data modeling are referred to as data learning and data discovery respectively, and are an essential part of insight generation.
Data Discovery
Data discovery is an interesting part of data modeling, as it involves finding patterns and potential insights in the data and building the scaffolds of your model. It is similar to data exploration, but here the focus is on features and how they can be used to build a robust model. Apart from being more targeted, it also entails different techniques. For example, in this step, you may be looking at how certain features correlate to each other, how they would collaborate as a set for predicting a particular target variable, how the graph representation of their information would look, and what insights it can yield.
Forming hypotheses and testing them is something that also plays an important role in this part of the pipeline (it is encountered in the data exploration step too, to some extent). This can only help you identify the signals in the datasets and the features that are of greater value for your model. You also need to get rid of redundant features and perhaps blend the essential features into meta-features (aka synthetic features) for an even better encapsulation of the signals you plan to use. So, in this step, you really go deep into the dataset and mine the insights that are low-hanging fruit, before employing more robust methods in the next step.
Data Learning
Data learning is about creating a robust model based on the discoveries made in the previous step, as well as testing the model in a reliable manner. If this sounds like a lot of fun, it’s because it is! In fact, most people who take an interest in data science get involved in it because of this step, which is heavily promoted by places like Kaggle (www.kaggle.com), a site hosting various data analytics competitions. Whatever the case, it is definitely the core step of the whole pipeline and deserves a lot of attention from various angles.
The models built in this step are in most cases mappings between the features (inputs) and the target variable (output). This takes the form of a predictive model, or in some cases, some sort of organizing structure (when the target variable is absent). For each general category of models, there are different evaluation criteria that measure the performance of each model. This has to do with how accurate the mapping is and how much time the whole process takes.
Note that the models are usually trained on some part of the dataset and tested on another. This way you can ensure their robustness and general usability (aka generalization). This detail is important, since if it is not taken into account, you risk having models that may seem very accurate but are useless in practice (because they don’t generalize). While a big part of this comes from experience, it is equally important (if not more important) to have a solid understanding of how models work and how they are applied, as well as the characteristics of a good model. The best part is that the whole process of acquiring this expertise is fairly quick (you can master it within a year) and very enjoyable, as it involves trying out various options, comparing them, and selecting which one best suits the problem at hand.
Information Distillation
This part of the data science pipeline is about summarizing everything you have done in the previous stages and making it available to your manager or client. This stage is important because of its visibility. Since it’s at the end of the pipeline and very close to the deadline of the project, it might be tempting to rush through. Yet, it’s imperative to resist this urge and spend the proper time and energy in this stage because it is tied to what the project stakeholders see or experience. Besides, without some solid work in this phase, all the work you’ve done in the previous parts of the pipeline may not get the visibility they deserve.
Begin by planning for distillation early in the project. For example, keeping a good documentation notebook while you go through the various steps of the pipeline is bound to be useful for this stage, since it’s doubtful you will remember all the details of the work you have done in those steps. Also, this kind of documentation will save you time when you prepare your presentations and product documents. In general, information distillation is comprised of two steps: data product creation (whenever there is a data product involved), and insight, deliverance, and visualization.
Data Product Creation
The creation of a data product is often a sophisticated task and isn’t mentioned much in other data science pipeline references. This is because in many cases, it has more to do with software engineering or website development. Still, it is an important aspect of data science, as it’s the main access point for most people to the data scientists’ work.
Data product creation involves an interface (usually accessible through a web browser, as in the case of an API), and an already trained model on the back-end. The user inputs some data through that interface and then waits for a second or so. During that time, the system translates this input into the appropriate features, feeds them to the model, obtains the result of the model, and then outputs it in a form that is easy to understand. During this whole process, the user is completely insulated from all the processes that yield this result.
In some cases, the user can have access to multiple results by paying a license fee to the company that owns the data product. This way, the user can obtain the results of many data points in bulk instead of having to input them one by one.
The creation of data products can be time-consuming and entail some running costs (the cloud servers they live on are not free!). Also, they usually involve the collaborative effort of both data scientists and software engineers; not many projects have the creation of such products as part of their pipeline. However, whenever they have them, this step is usually in the first part of the information distillation stage.
Insight, Deliverance, and Visualization
The deliverance of insights and/or data products and the visualization of the outputs of your analysis are key elements of the data science pipeline and oftentimes the only output of the whole process that is viewed outside the data science team. Still, many data science practitioners don’t do this step justice because it is very easy to get absorbed in other, more intriguing parts of the pipeline. The fact that it’s the last step of the pipeline doesn’t help either.
This part of the information distillation stage generally entails three things:
- Summary of all the main findings of your analysis into something that is actionable or at least interesting and insightful (hence the first term of this step’s name)
- Deliverance of your work, be it a model or a data product, to the stakeholders of the project
- Visuals that demonstrate your findings and performance of your model(s)
All of these are important, though what is most important depends on the project and the organization you work for. Regardless, it is best to know that beforehand so you put enough emphasis on that aspect of this phase, ensuring that everyone is as happy about the production cycle’s completion as you are.
This step of the data science pipeline is essential even if the rest of the steps can’t be completed for one reason or another. Half-baked results are better than no result at all in this case. I don’t recommend you leave anything unfinished, but if the time restraints or the data doesn’t allow for what you had originally envisioned, it is best to make an effort to present what you’ve found so that everyone is on the same page with you. If the data is of low veracity for example, and that jeopardized your work, your manager and colleagues need to know. It’s not your fault if the data you were given didn’t have any strong signals in it.
Putting It All Together
The data science pipeline is a complex beast. Nevertheless, with the right mindset, it is highly useful, providing structure to insight generation and the data product development process. Just like in conventional science, data science’s processes are not straight-forward, as every analysis is prone to unforeseen (and many times unforeseeable) situations. As such, being flexible is of paramount importance. That’s why we often need to go back to a step we’ve already spent time on, viewing the problem from different angles until we come up with a model that makes more sense.
If the process seems cyclic in the diagram in the beginning of the chapter, that is because typically it is cyclic in practice. It’s not uncommon to have several iterations of the pipeline, especially if the final stage is successful and the stakeholders are satisfied with your outputs. Every iteration is bound to be different. Perhaps you gain access to new data streams, or more data in the existing ones, or maybe you are asked to create a more elaborate model. Whatever the case, iterating over the data science process is far from boring, especially if you treat each iteration as a new beginning!
Summary
The data science pipeline is comprised of three distinct stages:
Data engineering involves refining the data so that it can be easily used in further analysis. It is comprised of three main steps:
- Data preparation: Cleaning the data, normalizing it, and putting it a form that it can be useful for data analysis work
- Data exploration: Playing around with the data to find potential signals and patterns that you can use in your models
- Data representation: Putting the data in the appropriate data structures, saving resources, and optimizing the efficiency of the models that ensue
Data modeling involves creating a series of models that map the data into something of interest (usually a variable you try to predict), as well as evaluating these models through:
- Data discovery: Finding useful patterns in the data that can be leveraged in the models as well as optimizing the feature set so that the information in it is expressed more succinctly
- Data learning: Developing (training) a series of models, evaluating (testing) them, and selecting those that are better suited for the problem at hand
Information distillation involves summarizing the findings of your analyses and possibly creating a product that makes use of your models using:
- Data product creation: Developing an application that uses your model(s) in the back-end
- Insight, deliverance, and visualization: Summarizing your findings into actionable insights, delivering them, and creating information-rich visuals
Overall, the pipeline is a highly non-linear process. There are many back-and-forths throughout a data science project, which is why as a data scientist, it’s best to be flexible when applying this formula.