
4
REQUIREMENTS ELICITATION AND ANALYSIS
4.1 Purpose of this Section
Requirements elicitation and analysis is the iterative work to plan, prepare, and conduct the elicitation of information from stakeholders, to analyze and document the results of that work, and to eventually define a set of requirements in sufficient detail to enable the definition and selection of the preferred solution. Within requirements elicitation and analysis, business analysts use a number of elicitation techniques and apply a number of analysis models to support the elicitation and analysis activities.
4.2 What it Means to Elicit Information
The common approach to obtaining requirements information is through “elicitation.” Requirements elicitation is the activity of drawing out information from stakeholders and other sources. In business analysis, it involves eliciting information about the causes of the business problem or the reasons for addressing a current opportunity, as well as the information that will eventually be used to derive a sufficient level of requirements to enable solution development and implementation.
4.2.1 Elicitation Is More than Requirements Collection or Gathering
The elicitation process is more than collecting or gathering requirements. The terminology “collecting” or “gathering” requirements implies that stakeholders already have requirements ready to be collected or gathered. Requirements are not ready and waiting in the stakeholders’ minds or in documents within the business community. While stakeholders may not have actual requirements, they do often have wants and needs; however, they may not be able to express them clearly. They may know there is a problem, but may not know exactly what the problem is. They may want to take advantage of an opportunity, but not know how to get started.
Part of the business analyst's job is to help the stakeholders define the problem or opportunity and determine what should be done to address it. The elicitation process helps facilitate this work. Some stakeholders may not even know their needs. For example, a start-up organization exploring potential opportunities may not have any idea of what to ask for. In this case, the business analysis process supports the discovery practices by eliciting and validating unknown needs. Stakeholders have information that is valuable to the business analyst, but the information is not necessarily in the form of a requirement that is ready and waiting to be collected.
4.2.2 Importance of Eliciting Information
The results of elicitation are a core input for business analysis work. Information is not only elicited to generate requirements or answer questions from the solution team, but the information becomes the basis to effectively complete other business analyst tasks, such as:
- Support executive decision making. Provides supporting information to the executives who are making strategic decisions about the direction of the organization. Considering that all such strategic decisions are business based, the business analyst objectively obtains the information necessary for these decisions to be made.
- Apply influence successfully. Influences to enable the completion of work. Business analysts have no vested authority; therefore, they should use influence in order to get things done. Influence is more successful when it is backed with information that supports the goal.
- Assist in negotiation or mediation. Negotiates on behalf of the project team, management, or business. In all such negotiations, the business analyst first elicits information and understands the motivations and/or goals of all sides in the conflict and then negotiates based on principle or objective facts.
- Resolve conflict. Provides information necessary to resolve conflicts. Business analysts are often brought in to resolve conflict or to serve as direct mediators for the project manager or business manager. Conflict is generally resolved with information, because conflict in business is usually the result of misinformation or assumptions based on a lack of information.
- Define problems. Provides the information to identify the real problem. The business analyst provides this information by identifying and analyzing the business processes that need improvement over the course of the analysis.
Failing to elicit enough information can result in erroneous conclusions and an increased number of assumptions, but too much information may hinder the team's ability to move forward. The art of elicitation is to obtain enough information to be able to validate requirements through a process of learning in order to confirm that the project team is delivering the right solution.
4.3 Plan for Elicitation
Some planning for elicitation occurred during the construction of the business analysis plan. Because planning is iterative, other planning is performed closer to when the activities are ready to begin. Prior to elicitation, the business analyst begins to focus on more specific details such as how to conduct elicitation, which stakeholders to involve, and which order to schedule elicitation sessions.
A well thought out approach to elicitation provides the following benefits:
- Clearer idea of the necessary information to define a problem, affect an improvement, or produce a solution;
- Fewer unnecessary elicitation activities;
- More valuable results from each elicitation session;
- More efficient and predictable use of stakeholder time to elicit the information; and
- Better overall focus on the entire elicitation process.
4.3.1 Develop the Elicitation Plan
An elicitation plan is a device used by business analysts to help formulate ideas about how to structure the elicitation activities. The plan is not a formal document and does not take a lot of time to create. It can be documented or can be the thought process used to prepare for the forthcoming elicitation efforts.
The work needed to create the elicitation plan involves thinking through how to best coordinate and conduct elicitation across a project. Some of the elements in an elicitation plan include but are not limited to:
- What information to elicit. What does the business analyst need to know in order to define the problem, solve the problem, or answer the question?
- Where to find that information. Where is that information located: in what document, from what source, in whose mind? Identify who has the information or where it is located.
- How to obtain the information. What method will be used to acquire the information from the source?
- Sequencing the Elicitation Activities. In what order should the elicitation activities be sequenced to acquire the needed information?
4.3.1.1 Finding Information
Sources of information may be (a) an individual the business analyst plans to elicit information from, (b) a model, or (c) other documented reference. Individuals in the elicitation plan should be identified by role rather than name. When information cannot be provided by individuals, the business analyst should consider leveraging basic elements of the enterprise architecture when one exists. Components within the enterprise architecture often contain reusable artifacts such as process flows, logical data models, business rule models, business domain models, etc. It is a good practice to try to identify at least two sources for each topic or question to be explored during elicitation, in order to avoid proposing any requirement or solution that is based on the opinion or information derived from a single source.
4.3.1.2 Techniques for Eliciting Information
There are several methods that are used to elicit information. Each technique has its own strengths and weaknesses. By understanding a variety of techniques, the business analyst has sufficient information to know which technique is best to use. Formal elicitation methods are planned and structured while informal methods are typically unplanned and/or unstructured. See Section 4.5.5 for a listing of commonly used elicitation techniques.
4.3.1.3 Sequencing the Elicitation Activities
There are dependencies that constrain the timing of elicitation activities. Some information is necessary before other information can be understood. Planning helps to identify and sequence information in the order the information needs to be collected. These dependencies may be documented in the elicitation plan to help organize the flow of elicitation activities.
Table 4-1 provides an example of a completed elicitation plan to move office staff to a new location.

4.4 Prepare for Elicitation
Elicitation preparation may be formal or informal. Elicitation preparation is the planning performed to conduct an effective elicitation session. The business analyst may create informal preparation notes to organize and to help facilitate the session. Preparation notes can be used to measure the progress achieved in a session against what was planned to be achieved and can be used to adjust expectations for future sessions.
4.4.1 Determine the Objectives
To ensure elicitation activities are effectively performed, the business analyst should set an objective for each session to achieve. The objective is the reason why the elicitation activity is being undertaken. Each session should provide some value and benefit to justify the time it takes to obtain the needed information.
4.4.2 Determine the Participants
At the completion of stakeholder analysis, the business analyst should have divided the long list of stakeholders identified into groups or classes. The results of the stakeholder analysis can be used when selecting the participants to invite to an elicitation session. If additional stakeholders were uncovered after the stakeholder analysis was completed, the business analyst should update the stakeholder register to ensure there are no stakeholder groups overlooked and factor in elicitation time for these new groups.
The business analyst schedules the appropriate amount of time for each stakeholder group; it may be appropriate to schedule less time with executives than with end users.
4.4.3 Determine the Questions for the Session
When the objective of the elicitation activity suggests using interviews, focus groups, facilitated workshops, or other techniques used to elicit information directly from stakeholders, the business analyst may want to prepare some questions prior to conducting the elicitation in order to ensure the session objectives are achieved. It is often effective to identify more questions than needed in the event that questions are answered more quickly than expected.
The business analyst should know the rationale for each question and be able to explain why a question is important or why it is being asked. Questions that do not move the session forward to achieving the desired objectives or those questions that obtain data that do not have a specific purpose should be avoided.
Figure 4-1 is an example of preparation notes for an elicitation session to discuss an office move.

The questions in Figure 4-1 are in no particular order. The business analyst may organize the questions with easy, nonthreatening questions at the beginning and end, with the more challenging, complex, or contentious questions in the middle of the session. Doing so helps the group make progress in the session early before needing to address the challenging questions, as well as ensuring the session ends on a positive note.
Elicitation preparation may be formal or informal depending on the preference of the business analyst. Preparation notes are solely for the benefit of the business analyst to ensure elicitation is facilitated effectively.
4.5 Conduct Elicitation Activities
There are four stages during the actual elicitation activity in which information is gathered:
- Introduction. The introduction sets the stage, sets the pace, and establishes the overall purpose for the elicitation session.
- Body. The body is where the questions are asked and the answers are given.
- Close. The close provides a graceful termination to the particular session.
- Follow-Up. The follow-up is where the information is consolidated and confirmed with the participants.
The information provided in Sections 4.5.1 through 4.5.4 is applicable whether the elicitation session is conducted in the form of an interview, workshop, or focus group. Section 4.5.5 provides a list of techniques that may be used to conduct elicitation.
4.5.1 Introduction
During the introduction, the business analyst establishes the frame for the session and sets the tone and rapport with the participants. The frame is created at the beginning of each session by stating the problem and by providing an overview of the session objectives. The frame is a cognitive technique that causes the participants in a session to subconsciously focus on the subject at hand. The structure keeps the participants on track and thinking about the objectives. Stating the benefits that will be achieved when the objectives are met helps to increase stakeholder participation and provides relevance to the information that participants are sharing.
The business analyst should consider use of a “parking lot” as a tool to keep participants on track. Parking lots are used to minimize sidetracking, derailing, or hijacking of the meeting by participants. The parking lot, created on easel pads, white boards, or electronic equivalent, is a place to store topics that have been raised by the participants which do not relate to the session objectives. The business analyst should explain the session rules including the use of the parking lot prior to the start of the elicitation.
4.5.2 Body
The body of the elicitation session is where the business analyst's soft skills come into play: active listening, empathy, body language, selection of questions to ask, sequencing of questions, influencing skills, etc. During the body, the business analyst elicits the primary information and achieves the objectives of the elicitation session.
Moving from the introduction to the body ideally should be a seamless transition. Handled well, the participants should not notice the shift to the more challenging questions and should continue to answer questions. The body is the portion of the session where momentum is built and the team is highly performing and engaged in providing a large amount of information.
4.5.2.1 Types of Questions
There are a number of different types of questions that can be asked. The business analyst selects the appropriate types of questions to meet the objectives and to mix up the question types in order to generate the most information.
Not all questions are planned. Much of the conversation during elicitation, while directed and investigative in nature, is spontaneous. Through practice and experience, the business analyst develops the ability to probe and further dig into the details and adjust the direction of questioning based on the responses received. The types of questions that can be asked are as follows:
- Open-ended question. A question that allows the respondents to answer in any way they desire.
- Closed-ended question. A question that calls for a response from a limited list of answer choices. Types of closed-ended questions are forced choice, limited choice, and confirmation.
- Contextual question. A question that requires an answer regarding the subject at hand; namely, the problem domain or the proposed solutions.
- Context-free question. A question that may be asked in any situation. Context-free questions are also used as lead-ins to obtain information to define the solution.
4.5.2.2 How to Ask the “Right” Questions
The right question is not known until after the question is answered and analyzed. There is no one right question that will provide the exact information that will generate the correct solution. In many cases, information that leads to the perfect solution arrives in pieces from many questions and many participants’ responses.
The more questions asked, the greater the chance to ask the right question. One way to know whether the right questions were asked is to analyze the results of the elicitation and assess the outcomes to see if the objectives of the session were achieved.
4.5.2.3 Listening
The business analyst needs to employ active listening to capture all of the information that comes with each answer. Active listening is the act of listening completely with all senses. Active listening entails paraphrasing or reciting back what is heard to ensure an accurate understanding of what has been communicated. It involves suspending all judgment about what is being heard so that information flows freely. When discrepancies in information are identified, the business analyst should not call attention to the discrepancy, but instead continue to draw out other clarifying information through questioning. One goal of active listening is to clear up discrepancies without raising the possibility of conflict.
During elicitation, some stakeholders will not provide information that they believe the business analyst may already know. In these scenarios, the stakeholder may provide only high-level answers to the questions raised, assuming that the business analyst understands the lower-level details. In order to gain access to the specifics, the business analyst needs to communicate to the stakeholders that the information being provided is unknown and needed. This will ensure the flow of information is provided at a sufficient level of detail.
4.5.3 Close
The close occurs at the end of an elicitation session. The purpose of the close is to wrap up the activities and focus on next steps. When the elicitation conducted was in the form of a workshop, the business analyst may consider a rundown of the assignment of action items so participants are aware of their responsibilities at the conclusion of the session. When the elicitation session was conducted in the form of an interview, the business analyst provides direction to the interviewee regarding next steps. The close is always used to thank participants for their contribution and time.
Three questions a business analyst may consider asking at the end of each elicitation session are as follows:
- Do you have any additional questions?
- Is there anything we missed or anything that we should have talked about but didn't?
- Is there anyone else who might have information that would contribute to the elicitation objectives?
Upon the conclusion of the elicitation session, the business analyst has a lot of information to process. As a result of analyzing this information, the business analyst may find that new questions emerge, ambiguities and contradictions surface, and clarity that was originally present turns to vagueness. This is not an uncommon outcome considering the large amount of information that is relayed during an elicitation session. The questions that arise during analysis become the materials to help structure the objectives for the follow-up sessions.
4.5.4 Follow-Up
In a follow-up session, after taking time to analyze and consolidate the information, the business analyst shares any revised notes and takes the opportunity to obtain confirmation from participants on the information obtained during the prior elicitation session. It is preferable to hold the follow-up after stakeholders have read the consolidated notes; however, business analysts will often find that participants do not have time to do so. The business analyst should use collaboration techniques to lead the participants through discussions to validate the consolidated information for accuracy and completeness before moving ahead.
A one or two paragraph summarization of the information elicited provides the following benefits:
- Provides an opportunity to fully analyze all the information received and to eliminate extraneous material;
- Allows time to verify and clarify the notes taken during the session, especially acronyms and abbreviations used in an effort to capture all of the information being provided;
- Uncovers any questions that should have been asked during the meeting;
- Reinforces to participants that their information is valuable enough for someone to spend the time to digest, analyze, and summarize it;
- Gives each participant a chance to respond to the summarization with additional information; and
- Provides participants with an opportunity to clarify or correct anything said previously.
Note: An alternative approach business analysts can employ is to produce all notes on a whiteboard during the elicitation session. Attendees can clarify and correct information on the spot to avoid a read-review process. The business analyst determines the appropriate process based on the size of the project and the complexity of the information being elicited.
4.5.5 Elicitation Techniques
Some common techniques used for elicitation are as follows:
4.5.5.1 Brainstorming
Brainstorming is a technique used to prompt innovation and creativity by asking groups to consider novel or different solutions. Output generated from the group is often greater than the output from the same group when solutions are recorded individually.
For additional information on how to conduct brainstorming, refer to Section 3.3.1.1.
4.5.5.2 Document Analysis
Document analysis is an elicitation technique used to analyze existing documentation and identify information relevant to the requirements. Business analysts can start their analysis work with this technique to gain some understanding of the environment and situation prior to engaging directly with stakeholders.
Document analysis provides the following benefits:
- Information received from individuals is subjective, whereas documented information tends to be more objective. While it is always good to have the subjective viewpoints of a number of different individuals on the same topic, it is best to have the objective and factual information first to use as a baseline to understand the subjectivity variations.
- Documents may contain information that no one individual has. This is found in older descriptions of a system or business process, source material for regulations, and other mandatory procedures.
- Individuals may not have a totally accurate view of the information, whereas written documentation has been researched and is more accurate.
- Written documentation provides more background and explanations than an individual explaining the same material, because the individual may assume that the business analyst already knows much of the information or that common knowledge has already been documented elsewhere.
- Up-to-date documentation can be a good source of information regarding the structure and capabilities of any product, ranging from physical structures (e.g., buildings) to devices with embedded systems (e.g., cellphones, pacemakers, or thermostats) to software (e.g., a claims payment system). A suite of up-to-date regression tests may serve the same purpose for obtaining accurate information about software and embedded system functionality.
The downside of the document analysis method is that documentation may not be available or the existing documentation may be out of date, thereby providing erroneous information. Even when documentation is maintained and considered current, there is a risk that previous system constraints or limitations will be documented as current business practices. It may be difficult for the business analyst to decipher these limitations without having a current conversation with a business stakeholder.
4.5.5.3 Facilitated Workshops
- Overview. Facilitated workshops, also known as requirements workshops, are focused sessions that bring key cross-functional stakeholders together to define product requirements. Workshops are considered a primary technique for quickly defining cross-functional requirements and reconciling stakeholder differences. Due to their interactive group nature, well-facilitated sessions can build trust, foster relationships, and improve communication among the participants, which can lead to increased stakeholder consensus. In addition:
- There is synergy when ideas from various people help to stimulate new thoughts from others.
- Disagreements among business units or individual stakeholders are resolved as they come up during elicitation, saving time later.
- Issues are discovered and resolved more quickly than in individual sessions.
- Obtaining agreement on issues is easier when the group is assembled together.
- Engagement is higher when stakeholders are urged to participate.
- There is a perception that no one stakeholder will have a higher influence on the solution, because everyone is in the meeting together.
The facilitated workshop may also include the solution team or its lead. The benefits of a cross-functional facilitated workshop are as follows:
- There is a team building aspect that unites the group.
- There is a better chance for a binding agreement between the solution team and the product stakeholders.
- The solution team is more committed when they are able to meet directly with the stakeholders for whom they are building the solution.
- The solution team or its lead learns the context of the problem, solution, and decisions, which provide a more informed basis for developing a solution.
- The requirements resulting from a combined meeting are more likely to be implemented, because the work was developed collaboratively.
- Workshop preparation. Workshops are expensive to run when considering the number of individuals involved and the time commitments required for each attendee to participate. However, when run efficiently, workshops can produce a lot of results in a short time period. In order to ensure the workshop gets off to a strong start, the business analyst should prepare as follows:
- Collaborate with the project team and stakeholders to agree on the agenda topics ahead of time.
- Produce an agenda and distribute it with the workshop invitation. If it cannot be sent with the invite, provide at least two business days’ notice.
- When the workshop will involve decision-making activities, ensure the team has already determined their decision-making process prior to the start of the workshop. This information should have been agreed upon during business analysis planning; however, in any event, it needs to be agreed upon before the start of the workshop.
- When any form of technology is being used to run the meeting, the meeting organizer needs to set up and start up all technical components prior to the start of the meeting. This may require that the organizer book the conference room 30 minutes to an hour prior to the start of the session so all technology is up and running prior to the start of the workshop. Examples of technology considerations are remote attendees dialing into a teleconference number, LCD projectors or web conferencing being used to display a presentation or notes, software used to obtain documents that will be discussed/reviewed, etc.
- Sufficient workshop materials are planned for and obtained prior to the start of the session. Stopping a workshop to retrieve materials loses the momentum.
- Invite participants by roles. When conducting a workshop or other form of elicitation within a group setting, invite attendees by role to avoid two persistent problems that often occur in elicitation sessions:
- Interlopers or those who are not invited or do not need to attend the meeting.
- Lack of attendance by those who are needed for the meeting but do not show.
Instead of a broadcast invitation to everyone having anything to do with the project, the business analyst should direct the invitations only to the roles required to achieve the workshop objectives. Inviting by role establishes expectations for participation and encourages attendance. Participants are more apt to prepare and provide the information needed from the perspective of their role, and are less likely to miss the meeting because they now have a specific responsibility to play in the meeting.
- Tips for running a workshop. Introduce participants or have the participants introduce themselves by role.
- Keep cross discussions and personal topics to a minimum to generate the most effective information.
- Start the meeting on time to send a message that everyone's time is important. To maintain momentum and focus, do not stop the meeting for latecomers but instead brief them during the break.
- Consider assigning separate roles, including a facilitator, a scribe, and a workshop owner to ensure a smoother session. It is a good practice to write directly on a whiteboard or some form of electronic medium so that the attendees can review the notes during the workshop. This reduces the need to conduct multiple reviews of the workshop results.
It is challenging to lead a session while controlling the meeting and participants. Facilitators help the business analyst and the meeting attendees to achieve the meeting objectives. The scribes help to ensure that the results are documented and the workshop owner makes the business decisions. Separating the roles often results in collecting more information as the practitioner is less distracted having to deal with multiple responsibilities.
Collaboration Point—It is not always practical for multiple business analysts to be present in a single facilitated workshop. This is an opportunity for the project manager and the business analyst to team up. The project manager may support the effort by fulfilling one of the roles, such as the scribe, thereby allowing the business analyst to focus on the questions and elicitation of information.
- Closing tips. Make it clear to the participants when the elicitation session will end. If there is a question and answer portion of the workshop, ensure that the participants know how many more questions can be raised and responded to. This allows for a nice transition to wrap up the meeting and does not leave attendees concerned that their questions will go unanswered.
- Follow-Up Tips. Schedule time to thoroughly analyze the information received as soon after the workshop as possible. Information and context may be lost when the meeting notes are not completed soon after the working session. Try to provide the summarized results back to the participants in a time frame that meets the participant's expectations. The participants will benefit from reviewing the session results soon after the meeting closes to ensure their recollection of the discussions is not forgotten.
Note: In today's project environment, there is more emphasis on collaboration and requirements discovery through team approaches. Unlike traditional meetings of the past, information does not simply flow from participant to facilitator, but can also flow among participants. Stakeholders may require meetings to discover from each other before they are able and ready to provide requirements information to the business analyst.
4.5.5.4 Focus Groups
A focus group is an elicitation technique that brings together prequalified stakeholders and subject matter experts to learn about their expectations and attitudes about a proposed product, service, or result.
Focus groups are used to gain feedback on completed work or prototypes. Generally, group members are prequalified or prescreened to ensure they meet the desired or targeted representation. A group size of 8 to 12 is optimal. The person chosen to facilitate the session should have experience moderating sessions of this type. The facilitator is often provided with an outline or a list of objectives to achieve in the session. Sessions are facilitated in a manner that allows for healthy team dynamics, a free flow of ideas, and a sufficient level of feedback to meet the session objectives.
Focus groups work well to allow participants to share ideas and build off of the feedback that is being shared among the group. The business analyst should watch reactions, facial expressions, and body language in addition to taking in the information being provided by the group. Due to their format and structure, focus groups are not a suitable method for eliciting information about a problem domain. One drawback of a focus group is that participants may be influenced by group pressure to agree with the stronger-willed participants. The facilitator plays an important role to engage the entire group and to ensure no one participant is demonstrating signs of being influenced by group pressure.
4.5.5.5 Interviews
An interview is a formal or informal approach to elicit information from stakeholders. It is performed by asking prepared and/or spontaneous questions and documenting the responses. Interviews are often conducted on an individual basis between an interviewer and an interviewee, but may involve multiple interviewers and/or multiple interviewees. Interviewing experienced project participants, stakeholders, and subject matter experts helps to identify and define the features and functions for the desired solution.
Interviews work well when:
- An individual has been identified as being able to provide a variety of information on a variety of topics.
- Confidential or sensitive information is needed that should not be discussed in an open forum.
- Information needs to be acquired from an upper-level manager.
- The business analyst needs to probe deeply into the issues surrounding the problem or problem domain and needs unfettered access and time from a specific individual who may have that information.
There are two basic types of interviews:
- Structured interviews. Begin with a list of prepared questions with the goal of asking and obtaining answers to every question on the list or within the allotted time.
- Unstructured interviews. Begin with a list of prepared questions, but the only question that is definitely asked is the first. After that, the subsequent questions are based on the answers to the previous questions. The interview takes on a life of its own and requires skill to keep the information focused on reaching the objective.
Interviews may be conducted synchronously or asynchronously:
- Synchronous Interviews. These interviews are performed live or in real time. These can be conducted in a number of ways, such as face-to-face where the business analyst and the interviewee are in the same room, or they can be conducted over the telephone, with video conferencing, internet collaboration tools, etc. The key is that the interview is being conducted with the interviewee and interviewer at the same time.
- Asynchronous interviews. These interviews are not conducted in real time; the business analyst or interviewer is not involved in the interview at the same time as the interviewee. Asynchronous interviews can be conducted through email or recorded, for example, where the interview questions are scripted and the interviewee records their responses to the questions through video.
There are a number of advantages to conducting an interview in person, for example:
- Having the undivided attention of the interviewee,
- Ability to see the body language and facial expressions accompanying the answers, perhaps more clearly than with video conferencing or collaboration tools, and
- Providing a more comfortable setting for the interviewee, especially if they are discussing sensitive information, for example, flaws with the current system.
With global organizations and international project teams, face-to-face elicitation activities are often replaced by teleconferences and videoconferences. There are a number of benefits associated with virtual meetings, including time and cost savings as well as the ability to bring people together from all over the world, which would not be possible otherwise.
Some of the disadvantages associated with conducting virtual interviews are:
- Interviewees multitask during the session, resulting in lost information;
- Participants call into the session from various locations, such as airports, parking lots, other client sites, etc., with the accompanying distractions;
- Lack of experience on the part of the interviewer and the interviewee participating in virtual meetings; and
- Equipment failure or poor performance of collaboration tools.
All of these obstacles can be overcome with proper training and with the establishment of ground rules for conducting virtual meetings. The use of virtual meetings to elicit requirements is likely to increase in the future due to the substantial cost and time savings that this approach provides.
4.5.5.6 Observation
Observation is a technique that provides a direct way of viewing people in their environment to see how they perform their jobs or tasks and carry out processes. It is particularly helpful for detailed processes when people who use the product have difficulty or are reluctant to articulate their requirements. Observation is also called job shadowing. It is usually performed externally by an observer who views the business expert performing his or her job. It can also be performed by a participant observer who performs a process or procedure to experience how it is done so as to uncover hidden requirements. The objective of the technique is to elicit requirements by observing stakeholders in their work environment.
Observation often results in the transfer of a greater amount of unbiased, objective, real information about the problem domain than with other forms of elicitation. When asked in a meeting to describe how to go about performing their work, it is probable that a stakeholder may miss steps or undercommunicate.
Cognitive experiments have shown that the more experienced a worker is, the more difficult it is for them to understand why specific decisions are made when performing a task. Through observation, the tasks and decisions being made are seen firsthand, and questions may be asked directly about why a particular decision is being made.
In business analysis, the business analyst fulfills the role of observer or participant observer. Observation in business analysis is not used to evaluate the performance of the worker, that is, to collect performance related information for input into a performance evaluation process. When the worker is suspicious of the observer, the value of observation may be diminished.
Additional benefits of observation are:
- Provides more insight into tasks and activities that are difficult to describe,
- Provides an opportunity to request a demonstration of complicated tasks or specific interactions with a system or product and to obtain an explanation of the process being performed,
- Provides information and visualization together, and
- Provides context around the activity.
There are four types of observation; each is used in a different situation:
- Passive observation. The business analyst observes the worker at work without interrupting, asking questions, or seeking clarification. The observer records the observations, often in the form of a process flow with timings recorded on the diagram. At a later date, the business analyst can ask the worker about the activities observed in order to clarify and validate notes. An advantage of passive observation is the minimal interruption to the workflow. As a result, an organization may not allow any other form of observation to be conducted, especially by an outsider. A disadvantage is that the worker may not trust the observer and may perform the work in a nonroutine fashion.
- Active observation. During active observation, the observer interrupts the process or activity, asks questions about what the worker is doing, seeks clarification, and asks for opinions, etc. The advantage of active observation is in the immediacy of information elicited and the increased amount of information collected. Active observation does, however, interrupt the flow of work which reduces productivity and possibly changes behaviors during the observation.
- Participatory observation. During participatory observation, the observer takes part in performing the activities being observed. It allows the observer to generate questions that would never have been thought of otherwise. In addition, the observer has an opportunity to experience what workers are going through when they perform these activities. The observer may discover functions, features, and improvements that would never come up during a facilitated workshop or interview.
- Simulation. The observer simulates the activities, operations, or processes of the work using a tool that recreates the work of a process worker in a simulation. The organization may have training facilities where the observer can interact with test versions of a system or product. With simulation, the business analyst follows up with the process worker through an interview to elicit further details.
The main drawback to observation is that people act differently when they are being observed. In addition, some managers may not support interruptions or may not allow firsthand observations. When observations are used, the information obtained should be reviewed and validated by the person who performed the demonstration to ensure accuracy and avoid any bias or assumptions that the business analyst may have introduced in the observation notes.
4.5.5.7 Prototyping
Prototyping is a method of obtaining early feedback on requirements by providing a working model of the expected product before building it. Since prototypes are tangible, stakeholders are able to experiment with a model of the final product rather than discussing abstract representations of the requirements. Prototypes support the concept of progressive elaboration in iterative cycles of mockup creation, user experimentation, feedback generation, and prototype revision. A prototype can be a mockup of the real result as in an architectural model, or it can be an early version of the product itself.
Elicitation and thorough investigation may not uncover all of the attributes or aspects of a complex solution. Allowing the users and customers to see the product or system as it is being built provides an opportunity for the business to identify issues, clarify requirements, and provide additional information that may have been omitted originally.
The key element to prototyping is the iterative process of creating the prototype, reviewing it with the pertinent stakeholders, making adjustments and modifications to the prototype, and reviewing it again. This process continues until all parties agree that the prototype has provided the needed information to the solution team.
There are two types of prototypes: low-fidelity prototypes and high-fidelity prototypes.
- Low-fidelity prototype. Low-fidelity prototypes are completed with a pen and paper, marker and whiteboard, or modeling tool on the computer. Examples of low-fidelity prototypes include:
- Wireframes,
- Mockups of interface screens or reports,
- Architectural renderings of a building,
- Floor plans,
- Sketches of a new product, and
- Any design that is evolving.
A typical use for a low-fidelity prototype is to mock up user interface screens and share them with the intended users to provide a visual representation of what the product/solution will look like and how it will function.
- High-fidelity prototyping. High-fidelity prototypes create a representation of the final finished product and are usable by the stakeholders who are reviewing them. Typically, the prototype has limited data, is restricted to a single computer device, and has partial functionality. High-fidelity prototyping is performed in an iterative fashion. Reviewers can manipulate the screen, enter some data, and move from screen to screen to experience firsthand how the screen will work.
There are two types of high-fidelity prototypes: throwaway and evolutionary.
- Throwaway prototypes are discarded once the interface has been confirmed. This is similar to the product prototypes developed by manufacturing companies. The prototype is used to help define the tools and process for manufacturing the product but the prototype itself is not sold.
- Evolutionary prototypes are the actual finished product in process. The first prototype that is reviewed is the earliest workable version of the final product. With each successive prototyping session, more functionality is added or the existing functionality is modified to achieve a higher level of quality.
Note: With agile project teams, evolutionary development is how the product is built. The work is not considered to be a prototype but is an actual slice of the product itself.
Two examples of prototyping techniques are:
- Storyboarding. Storyboarding is a prototyping technique showing sequence or navigation through a series of images or illustrations. In software development, storyboards use mockups to show navigation paths through webpages, screens, or other user interfaces. Storyboards are graphical representations that represent the sequence of events. Storyboards are typically static and thrown away. Prototypes focus on what the product will look and feel like, while storyboards focus on the experience.
- Wireframes. A wireframe is a diagram representing a static blueprint or schematic of a user interface and is used to identify basic functionality. A wireframe separates the look and feel of a site from its function. It presents a stripped-down, simplified version of the page, devoid of distractions. The purpose of the wireframe is to illustrate the flow of specific logical and business functions by identifying all entry and exit points or actions the users will experience. A typical wireframe contains:
- Key page elements such as header, footer, navigation, content objects, branding elements, and their respective locations;
- Groupings of elements such as side bars, navigation bars, and content areas;
- Labeling, page title, and navigation links; and
- Placeholders, content text, and images.
Wireframes can be developed as a basic blueprint with low fidelity and may serve as an inexpensive approach to gleaning design preferences from stakeholders. Wireframes drive communication and help to support evolutionary discovery of requirements.
4.5.5.8 Questionnaires and Surveys
Questionnaires and surveys are written sets of questions designed to quickly accumulate information from a large number of respondents. Respondents represent a diverse population and are often dispersed over a wide geographical area. This method is beneficial for collecting a large amount of information from a large group over a short period of time at a relatively small expense. However, questionnaires and surveys also have these disadvantages:
- There is no opportunity for clarification, which could render the answers meaningless. In a face-to-face meeting, questions can be clarified when the answer is not what is expected.
- The formulation of the questions are often closed-ended, which could also render the answers meaningless.
- The number of responses the business analyst receives may not be significant enough to serve as a representative sample. A return rate of approximately 4 to 7% is not uncommon for a survey conducted within an organization. This means that without careful consideration of the survey sample, the information may be significantly prejudicial and draw the wrong conclusions.
For example, respondents who have an extreme reaction to a subject will tend to answer the survey to promote their ideas or concerns. When there is a small return on a survey that was distributed to a wide group of people, the results may only reflect those with an avid interest in a certain aspect of the survey, thereby skewing the results unfavorably.
Some ways of limiting the risks associated with surveys are as follows:
- Determine the number of respondents that will be required. Use a sample size calculator to determine the sample size needed for a statistically significant response.
- Analyze for skewed information when the surveys are returned. This will require that the survey includes some type of demographic or segmenting question to enable this analysis.
- Share information regarding why the survey is important to the organization and project.
- Send out reminders during the survey window to encourage and promote participation.
- Ask an upper management representative to champion the effort and emphasize its importance.
Make the survey results available to those who participate in the process as a follow-up and thank them for taking the time to complete the survey.
4.6 Document Outputs from Elicitation Activities
It is important to document the results of elicitation activities, either formally or informally. Documentation can range in formality from snapshots of whiteboards to fielded information recorded in requirements management tools. The primary documented result is a set of elicitation notes comprised of a wealth of information for performing other business analysis tasks. The results may come in the form of sketches, diagrams, models, flipcharts, sticky notes, or index cards, to name a few. When the elicitation results are analyzed, the results are documented into the deliverables and forms geared to the audiences who will use them.
4.7 Complete Elicitation
The elicitation process is an iterative process of alternating the steps of eliciting information and analyzing the information obtained. It can be considered a progressive elaboration of information. When information is analyzed, the quantity sometimes decreases, because extraneous information is removed. However, when the results are vague and open to interpretation, additional questions need to be asked and more elicitation sessions are then conducted.
A typical business analysis quandary is determining when the elicitation stops and the analysis starts and for how long the work continues. Analysis generates additional questions to clarify ambiguities, solidify vagueness, and add in more information about a particular topic, etc. This results in another round of elicitation activity, which increases the quantity of information, followed by another round of analysis decreasing the quantity of information. This continues until the analysis produces no further questions and the information is reduced down to a depiction of the solution to the business problem or when the risk of problems emerging from the lack of complete information is considered to be acceptable; and that is when elicitation ends.
Note: Projects using an adaptive life cycle need to plan sufficient time for elicitation and analysis, but analysis is not usually estimated separately. Instead, analysis is taken into consideration and understood to be part of an estimate for the delivery of features or functionality within an iteration. Analysis occurs throughout the project as part of defining the initial backlog, grooming the backlog as the project moves forward, and analyzing details for each iteration.
The following may indicate when sufficient information has been elicited:
- The stakeholder or problem owner approves the results.
- The model on which the information is based can be completed.
- A dry run or successful prototype is completed.
- The objective has been reached.
- The solution(s) has been identified.
- Stakeholders begin repeating themselves and providing redundant information.
- It takes longer to get answers out of the same stakeholders. Stakeholders are trying to come up with new information that is different from what they previously gave, because elicitation is still in process.
- All information pertaining to high-priority requirements has been confirmed by at least two independent sources.
Note: For a project following an adaptive project life cycle, the project team pushes toward replacing up-front analysis in favor of eliciting details within the increment in which the features will be delivered.
4.8 Elicitation Issues and Challenges
There are a number of difficulties associated with elicitation, for example:
- Conflicting viewpoints and needs among different types of users,
- Conflicting information and resulting requirements from different business units,
- Unstated or assumed information on the part of the stakeholders,
- Stakeholders who are resistant to change and may fail to cooperate and possibly sabotage the work,
- Inability to schedule time for interviewing or elicitation sessions because stakeholders cannot take time away from their work,
- Inability of stakeholders to express what they do or what they would like to do, and
- Inability of stakeholders to refrain from focusing on a solution.
The following lists some elicitation challenges and a few suggestions for meeting those challenges:
- The business analyst cannot gain access to the right stakeholders. A common issue business analysts face during the elicitation process is the inability to directly interact with the actual users of the product or system. As a result, user interfaces or processes may need to be developed without access to or input from those who are directly impacted by the proposed changes.
The business analyst can address this issue by focusing on the information not the individual. Sometimes the desired information is available from multiple sources, for example, documentation, training materials, operating procedures, etc. The business analyst may look to these other sources when gaining access to stakeholders proves to be difficult but needs to realize that doing so comes with great risk. The sponsor, project manager, and project team need to be fully aware when these situations arise, because moving ahead without the right stakeholders often leads to solutions that the business never accepts.
- Stakeholders do not know what they want. It can be frustrating trying to elicit requirements from stakeholders who do not know what the product is that they are asking for. There is a sense that the business stakeholders want to try various features until something works, but there is schedule pressure to produce sufficient requirements for the solution development team.
To address this challenge, using techniques such as prototyping or storyboards may help the stakeholders visualize each of the possible solutions. The project team may consider using an adaptive project life cycle since it a preferred approach when there are changing customer needs or when stakeholders need to visualize the solution to further define their requirements.
- Stakeholders are having difficulty defining their requirements. Many business stakeholders come to elicitation activities with a solution in mind, and it may be difficult for them to describe the business problem they are trying to solve.
To address this challenge, the business analyst should ask the business stakeholders for help in understanding the problem domain and focus their attention on the problem or opportunity they wish to address. After clarifying the situation, the discussion should be focused on the high-level requirements. When the business analyst helps to break down the high-level requirements and walks the stakeholders through the process, the stakeholders will be prevented from moving directly to the solution. When it becomes difficult to elicit needs and high-level requirements from the stakeholders, the business analyst needs to continue to ask clarifying questions to draw out the requirements.
- Stakeholders are not providing sufficient detail to develop the solution. Stakeholders may not have experience providing requirements or do not understand the business analysis process or business analyst role. Sometimes stakeholders are unaware of the level of detail that the business analyst wants to know or cannot figure out how to go about describing such details.
To address this issue, the business analyst should try to elicit requirements through visual modeling techniques. Engaging stakeholders in modeling can open up dialogue that may not be possible through interview questions, surveys, or straight discussion. Ask stakeholders to help complete a workflow or to assist with breaking down a problem into a hierarchical model. This process focuses the stakeholder on completing the visual elements, resulting in discovery of details that might not be possible to obtain without the imagery.
4.9 Analyze Requirements
4.9.1 Plan for Analysis
4.9.1.1 Analysis Defined
One of the primary activities that business analysts perform is analysis, with much effort focused on requirements-related information. Analysis is the process of examining, breaking down, and synthesizing information to further understand it, complete it, and improve it. Analysis entails looking closely at the parts of the information and how they relate to one another. Analysis involves progressively and iteratively working through information to lower levels of detail and often entails abstracting to higher levels of detail. Analysis is used to provide structure to the requirements and related information.
4.9.1.2 Thinking Ahead about Analysis
Planning for analysis involves thinking about what activities and techniques are likely to be useful and when they should be used. Not all techniques need to be decided before analysis begins, but by thinking ahead, it is more likely that business analysts will be prepared to use a variety of techniques.
Part of planning for analysis includes determining which types of models would be most beneficial given what is known about the project. There are a number of analysis techniques to choose from, and each technique has strengths and circumstances to which it is best used. A business analyst will likely not be proficient in every technique; however, it is valuable to learn as many techniques as possible and develop the skills and experience to know when a particular technique is best leveraged. Consider which analysis tools could be applied, such as modeling tools, and which templates could be used. Decide in advance which modeling language to use, if any. Determine what existing models in the organization could be used as a starting point for the current project. Plan for analysis based on known information but also be able and ready to adjust plans to the unexpected discoveries that occur throughout the business analysis process.
4.9.1.3 What to Analyze
Business analysts work with different types of information. Choose the correct information to analyze and separate out those things that interfere with a proper analysis. Use visual models to help establish a boundary on exactly what needs to be analyzed and to help facilitate discussions with stakeholders and subject matter experts when determining the key pieces of information. Most often, business analysts conduct analysis on the outputs of elicitation activities. In addition, analysis frequently provokes relevant and important questions about the situation, requiring more elicitation. Regardless of the business analysis approach used, elicitation and analysis are usually iterative.
4.10 Model and Refine Requirements
4.10.1 Description of Models
In this practice guide, the model refers to a visual representation of information, both abstract and specific, that operates under a set of guidelines in order to efficiently arrange and convey a lot of information in a concise manner. In its simplest form, a business analysis model is a structured representation of information. Models are diagrams, tables, or structured text. Models are created with a variety of tools, ranging from formal modeling tools to whiteboards to artistic software. There are many business analysis models and each serves one or more purposes. Examples of information related to business analysis that can be modeled include business objectives, requirements, business rules, and design.
4.10.2 Purpose of Models
Business analysis models are helpful to find gaps in information and to identify extraneous information. Models provide context to better understand and more clearly convey information. Requirements are modeled and refined to achieve further clarity, correctness, and to elicit additional information to define the details necessary for the product to be built.
When the correct models are applied, analysis becomes simple relative to analyzing the information in pure text form, because the models help visualize and summarize complex information. When the correct models are applied, analysis becomes much easier.
4.10.3 Categories of Models
Analysis models are organized into specific categories, defined mostly by the primary subject matter represented. One categorization of models is shown in Table 4-2, along with examples of each model.
Table 4-2. Models Organized by Category
| Category | Definition | Example Models |
| Scope models | Models that structure and organize the features, functions, and boundaries of the business domain being analyzed |
• Goal and business objectives model • Ecosystem map • Context diagram • Feature model • Organizational chart (described in Business Analysis Planning) • Use case diagram • Decomposition model (described in Business Analysis Planning) • Fishbone diagram (described in Needs Assessment) • Interrelationship diagram (described in Needs Assessment) • SWOT diagram (described in Needs Assessment) |
| Process models | Models that describe business processes and ways in which stakeholders interact with those processes |
• Process flow • Use case • User story |
| Rule models | Models of concepts and behaviors that define or constrain aspects of a business in order to enforce established business policies |
• Business rules catalog • Decision tree • Decision table |
| Data models | Models that document the data used in a process or system and its life cycle |
• Entity relationship diagram • Data flow diagram • Data dictionary • State table • State diagram |
| Interface models | Models that assist in understanding specific systems and their relationships within a solution |
• Report table • System interface table • User interface flow • Wireframes • Display-action-response |
4.10.4 Selection of Models
Choosing the correct model can be difficult because often there are multiple valid choices. It is unlikely that all of the models will be used on one project, but for most projects, more than one type of model will be used. In some cases, there are many models that could be applied, but time constraints may require the business analyst to choose only a few of the models. In these scenarios, models need to be prioritized according to applicability. The business analyst should consider the following when choosing which models to use:
- Methodology. The choice of models or formality and depth of models can be methodology independent. However, certain models are more suited to one methodology than another.
- Characteristics of the project. Project characteristics, such as, business process, automation, custom development, commercial-off-the-shelf, cloud or software as a service, data migration, workflow, mobile, hardware, software, number of users, analytics, and reporting are considerations when selecting the correct models for the project.
- Timing within the project life cycle. Some models are better used early in a project when defining the project's value and scope, or when identifying stakeholders. Other models are more appropriate as the project progresses and the low levels of details are being described.
- Categories of models. Models from every category (see Table 4-2) should be considered on every project.
- Level of abstraction. Models represent different abstraction levels. Some are better suited for analyzing a whole solution, others for elements of a solution, and others for details within an element.
For example, an agile project will likely use user stories as opposed to use cases. A reporting or analytics project will likely use data models, including a data dictionary and report tables. A system migration project will probably have scope models such as an ecosystem map or context diagram, as well as data models like a data dictionary and a business rules catalog. Early in a project, business analysts usually create context diagrams, ecosystem maps, and high-level process flows. Later in a project, business analysts may create state models, decision models, and user interface models. A project that involves automating operational functions benefits from process models to elicit information about how work is currently conducted and how work will be performed after the automation is implemented.
It is helpful to use more than one model, because the models complement one another and enable analysis of the project from different perspectives. For example, a data dictionary describes attributes of the business data objects and those data objects are also reflected in an entity relationship diagram. The allowed transitions on a state diagram are reflected in one or more process models. Cross-checking models against each other will help find gaps, unnecessary information, and potentially missing requirements.
4.10.5 Use Models to Refine Requirements
Business analysts use models to determine what is important and valuable so that the right requirements are created. Models are used during elicitation sessions to refine requirements with stakeholders or subject matter experts. Through an iterative process, the details become sharper and sharper until there is a clear enough picture as to what is important and what is not. Each model explained in Sections 4.10.7 through 4.10.11 describes how the model helps to identify and refine requirements or how the model relates to requirements.
4.10.6 Modeling Languages
There are many modeling languages, and each has its strengths and weaknesses. Some common modeling languages used in business analysis are described in Table 4-3.
Table 4-3. Modeling Languages and Usage
| Modeling Language | Overview of Usage |
| Business process modeling notation (BPMN) | Used to model complex business processes for the purpose of making changes to these processes. |
| Requirements modeling language (RML) | Used to visually model requirements for easy consumption by all stakeholders, particularly business stakeholders. |
| System modeling language (SysML) | Used to analyze complex systems and includes a subset of UML. |
| Unified modeling language (UML) | Primarily used to specify design models but can work well to specify requirements. |
| Various other modeling languages | Used when a specific modeling language isn't appropriate or not part of the organizational standards. For example, process models are frequently created using ISO-standard flowchart symbols. Data models often use Information Engineering “crow's foot” notation. |
Whether a specific modeling standard is used during analysis or not is unimportant; what is important is to use consistent syntax each time a similar model is used so as not confuse stakeholders. For example, when creating process flows, use the same shapes to mean the same things. In addition, it is helpful to keep the models as simple as possible. It is difficult for stakeholders to read and understand models that contain overly complex syntax and information. Some organizations develop guidelines and standards to ensure consistency across the organization. It is helpful to add a key or legend to a model to ensure that everyone understands what the symbols represent.
Sections 4.10.7 through 4.10.11 describe a variety of models from each category. Each model description includes an overview of the model and its syntax, an example, common ways it is used, and how the model relates to requirements.
Example—The examples for the models are based on a mock project called “recipe box” for a grocery chain. This is a mobile application project that allows users to select recipes, look up grocery stores that have the ingredients, and then map the location of the ingredients in the store. A new recipe is sent daily by email to participating customers. Ingredients for the recipe are on sale at each of the grocery stores. Customers can use a mobile device to run the Recipe Box application to display the current and past recipes. The application also shows the location of the items for the recipe at the store selected by the customer.
4.10.7 Scope Models
In general, scope models are used to structure and organize the goals, objectives, features, functions, and boundaries of the business domain being analyzed.
4.10.7.1 Goal Model and Business Objective Model
Goal models and business objective models are diagrams for organizing and reflecting goals, business problems, business objectives, success metrics, and high-level features. Chains of business problems and business objectives easily show where the project value comes from. Whether the value is identified as increasing revenue, decreasing cost, or avoiding penalties, goal models and business objective models visually represent the value that supports feature prioritization decisions and product scope management.
Collaboration Point—The project manager may be able to help complete portions of the goals and business objectives. For example, when the project manager has already developed a cost-benefit analysis or business case, some of the information needed in this model may already exist.
Example—Figure 4-2 shows one form of business objectives model for the Recipe Box project. In this example, the high-level features trace back to the overarching business problem that is being addressed—profit per visit is down. The measurable business objective is to increase profit per visit by $3 (a goal determined by the business group). To increase profit per visit, the grocery chain wants to increase sales of items that are more profitable. The Recipe Box product includes features that increase the consumer's desire to purchase such items and also make it easier for them to locate and purchase the items.

- Usage. Although commonly constructed during the planning phase, a goal model or business objectives model can be created at any time during the project. It may be helpful to create the model as soon as possible so that teams and business owners can start assigning the numbers to the features they are attempting to develop for a particular product. It can be used to justify budgets as well as to reveal to executives exactly what they are receiving from a project. When business objectives are mapped to the requirements, scope control becomes much easier as the particular value of a specific requirement is better understood.
- Relationship to Requirements. These models provide a structure to specify business requirements. Each functional requirement produced for a project should be traceable to the identified business problems and objectives. Maintaining a focus on the top-level business problems and business objectives guides the delivery of valuable solutions and shapes the scope of the features. The value of requirements or features can be quantified based on how these requirements contribute to the business objectives in the model; this helps to identify the most important features to implement or identifies the minimally marketable features (MMFs).
4.10.7.2 Ecosystem Map
An ecosystem map is a diagram that shows all the relevant systems, the relationships between them, and optionally, any data objects passed between them. The systems are logical systems and therefore may not match an actual architecture diagram of physical systems. An ecosystem map is made up of boxes representing the systems and lines between the boxes that depict the relationships. When data is shown in the diagram, the labels on the lines identify the data objects and the arrows show the direction that the data flows. A system should be depicted in an ecosystem map when it is in scope for the project. It should also be shown when it is a system that passes or consumes data used by or manipulated by the systems in the project.
Example—Figure 4-3 is an ecosystem map for all of the systems within the grocery store solution and their interactions. This ecosystem map contains all of the systems that operate within a single grocery store, including external systems that transfer data. Although some of the systems do not directly interact with the Mobile App, the data generated or transferred can interact with the mobile application by means of an intermediary system.

- Usage. An ecosystem map is used to understand all of the systems that may be affected by or that will impact the in-scope systems. It is a good model to represent systems that are in scope early in a project. In particular, the model is used to determine where there are possible interface requirements or data requirements.
This model is slightly different than a context diagram, because ecosystem diagrams may include interfaces and systems that the solution under analysis does not interact with directly.
Example—When a mobile application is being developed and there is a shelf layout system that directly interacts with the mobile application, both systems should appear in an ecosystem map and a context diagram. However, there could be an inventory system that does not interface with the mobile application, but does interface with the shelf layout system. In this case, a business analyst may decide to show the inventory system in an ecosystem map so the audience understands the source for the inventory data that the shelf system is using. A context diagram would not show the inventory system, because it does not directly interface with the mobile application. Using the ecosystem map, a business analyst considers how the systems relate and sees interactions that may otherwise have been overlooked. Context diagrams are explained in Section 4.10.7.3.
- Relationship to Requirements. An ecosystem map is a high-level representation of system interfaces, but it does not contain specific requirements about these interfaces. System interface tables should be completed for each of the interfaces identified in an ecosystem map. Data models should be created to define data requirements for each of the data objects passed between the systems.
4.10.7.3 Context Diagram
A context diagram shows all of the direct system and human interfaces to systems within a solution. The diagram shows the in-scope system or systems and any inputs or outputs including the systems or actors providing or receiving them. A context diagram typically shows the system under development in the center as a circle, interfacing systems as boxes, human actors as people shapes or boxes, and lines connecting them to show the actual interfaces and the data passed between them. Context diagrams are sometimes referred to as Level 0 of a data flow diagram. Data flow diagrams are further discussed in Section 4.10.10.2.
Example—The context diagram in Figure 4-4 displays the interactions between the Mobile App system being developed and external entities. It is similar to the ecosystem map in concept, because it illustrates data transfer or interactions between systems, but it includes more entities than just systems, such as the grocery shopper, and it only includes entities that directly interact with the system being developed. For example, the inventory system sends information to the shelf layout system. Both systems are included in the ecosystem map, but only the shelf layout system is in the context diagram as it has a direct interface.
- Usage. Context diagrams are particularly useful early in a project to specify the scope of the project, including any interfaces that have to be developed. It also shows all of the external touch points between the system under development and other systems or people. Context diagrams are also helpful in determining where there could be interface requirements or data requirements. Context diagrams have begun to be used by business analysts more broadly (i.e., to model business, user, and data contexts), because context diagrams are easy to build and understand. Context diagrams can also model the as-is and the to-be states in order to help with gap analysis.
- Relationship to Requirements. Context diagrams do not specify requirements but summarize the product scope and related information that are analyzed to identify requirements. Because context diagrams are used to specify all of the interfaces, these diagrams can help identify when interface requirements need to be elicited, for example, system and human interface requirements. This model often leads a business analyst to create system interface tables, user interface flows, display-action-response models, or other interface models that help to specify interface requirements.

4.10.7.4 Feature Model
A feature model is a visual representation of all of the features of a solution arranged in a tree or hierarchical structure. The structure can be horizontal or vertical. A feature is a group of related requirements described in a few words. Most projects have features at varying levels; the top-level features are called Level 1 (L1) features, followed by Level 2 (L2) features, and so on. Most feature models will have three or fewer levels of features. A given branch of the feature model always has a feature at the end of it, with lower level features hanging off the branch.
Example—Figure 4-5 demonstrates features for a simple Recipe Box solution. This feature model shows five L1 features such as list, recipe, and guide with the respective L2 features. For a few of the L2 features, there are L3 features also shown. The different choice of font color in this diagram is used to denote scope. For example, list, recipe, and guide are included in the current iteration and the rest (the features in light gray) are for future iterations. Feature models can be embellished using color or patterns to indicate scope. For example, one color could be used to show what is in scope for the current release and another color could show what is out of scope.
- Usage. Feature models are helpful to show how features are grouped together and which features are subfeatures of other ones. Feature models are useful because they can easily display up to 200 features across different levels on a single page, which may represent an entire solution's feature set.
- Relationship to Requirements. Feature models usually do not show requirements, but rather sets of requirements (features). Feature models help to determine how to organize requirements for business analysis efforts or lay out features in a requirements document. The features found within a feature model may also be used to trace requirements to ensure that no features or requirements are forgotten.

4.10.7.5 Use Case Diagram
A use case diagram shows all of the in-scope use cases for a system. In a use case diagram, a use case is represented by an oval with the name of the use case within it as shown in the Figure 4-6. An actor is shown as a stick figure. Straight lines in the diagram associate the use cases that the actor interacts with. The association does not represent the flow of information into or out of the use case. The association merely establishes a connection that shows this actor is in some way associated with the use case. Use cases are further explained in 4.10.8.2 below.
Example—Figure 4-6 shows a use case diagram with a sample set of use cases for the recipe box system.

- Usage. Use case diagrams can be used to summarize the scope of a solution, highlighting the main features to be added (i.e., the use cases). These diagrams also show the stakeholders who directly interact with the solution (actors), and the interfaces that need to be created between the system features (use cases) and the actors. Use case diagrams can also indicate use cases that are out of scope, which is helpful to manage stakeholder expectations.
- Relationship to requirements. Use case diagrams help the project team plan and track progress in building a solution. These diagrams help to summarize the scope of features and the relationship of features to actors. Use case diagrams do not show requirements, but help to organize requirements for business analysis efforts or layout in a requirements document.
4.10.8 Process Models
Process models describe the user or stakeholder elements of a solution, process, or project.
4.10.8.1 Process Flow
Process flows, also called swimlane diagrams, process maps, process diagrams, or process flow charts, visually depict the tasks that people perform in their jobs. Typically, process flows describe the steps that people take, although they may describe system steps and could be called system flows. In process flows, boxes depict steps, diamonds indicate decision logic, and arrows show the order of flow. Process flows may also contain swimlanes, which group steps together that are performed by the same person, group of people, or system. It is helpful to describe only people or system process steps in a given diagram to reduce shifting the context for the reader between the human and system processes. Process flows are developed to model the as-is processes (e.g., how activities are currently performed) in an organization as well as the to-be processes (e.g., proposed process revisions or new proposed processes).
Example—Figure 4-7 shows the process flow for creating and sending the daily recipe for the recipe box application. This process flow has two swimlanes: the customer and the store representative.

- Usage. Process flows are valuable on most types of projects where there are people performing tasks in the solution. Process flows are particularly useful for facilitating conversations during elicitation with business stakeholders because process flows are intuitive to create and read. During analysis, process flows are used to identify missing features or requirements by tracking requirements to individual steps within the process flows. Process flows can be drafted ahead of time or created real-time during sessions and are an easy model for business stakeholders to review as part of requirements verification. Process flows can be used to discuss as-is processes for current solutions and future processes for new solutions to identify changes or gaps. Software developers and testers find process flows to be useful to provide context for a set of requirements.
Process flows are also used to show key performance indicator (KPI) metrics, either the baseline or target metrics. Each KPI is shown in brackets over the step or steps the metric applies to. This is useful when creating solutions to replace existing solutions where there is already a performance level threshold that needs to be maintained.
- Relationship to requirements. Process flows are an easy model for deriving requirements by consideration of the functionality or qualities needed to support each step of a business process. This is done during elicitation sessions or during analysis. When requirements are already specified, these can be traced back to the process flow steps to see if there are requirements missing (steps that do not have sufficient requirements mapped) or requirements that are unnecessary (requirements that do not support any steps in a process).
4.10.8.2 Use Case
A use case describes a set of scenarios. A scenario is any single pass through a system to achieve a goal for the primary actor. A use case is a series of activities, actions, and reactions that take the primary actor from initiation to successful completion of the goal. Textual use cases are represented in a standardized document template or in tabular form with standardized columns.
Use cases represent the functional aspects of a system or operation and, as such, are not used to document the nonfunctional aspects of a system (e.g., how fast the product should work, how durable it needs to be, what the capacities will be, etc.). When documenting nonfunctional requirements on a project with use cases or user stories, consider placing the nonfunctional requirements into a separate document. Nonfunctional requirements generally apply to the entire system rather than a single use case; therefore, it makes better sense for them to reside outside of any particular use case.
Common fields include:
- Name. A verb phrase that indicates the goal of the use case.
- Description. A simple explanation of the use case.
- Actors. Roles that are active participants in the use case.
- Organizational benefit. Describes why the use case is important to the project or organization; used for prioritization.
- Trigger. The event that causes the use case to start.
- Preconditions. Describes everything that should be in place prior to the use case starting in order for the use case to succeed.
- Normal flow. The normal course of steps to move from the preconditions to the post conditions.
- Post conditions. Everything that has changed in the environment at the end of a use case.
- Alternate flows. Alternative sets of steps an actor can take to achieve the goal other than what is described in the main flow. These flows are often branch points from steps in the main flow.
- Exception flows. Errors or disruptions in the normal flow that require an actor or system to perform a different action to respond to the exception. These are often branch points from steps in the main flow and will usually terminate a use case. Exception flows result in failure or nonachievement of the goal.
A single stakeholder may be represented by multiple roles that mirror the multiple roles that the stakeholder plays in the business. Similarly, many stakeholders may be represented by a single role. The normal flow is commonly referred to as the happy path or main success scenario.
Example—The example shows a use case for a mobile application that a shopper can use to find the ingredients for a recipe in a store. The alternate and exception flows are referenced from various steps in the main flow to show where the flow branches.
- Usage. Use cases are used when there are complex back and forth interactions between users and systems. These can be used during elicitation sessions to discover and describe complex interactions. Use cases are used during analysis and then later reviewed with stakeholders. Similar to process flows, use cases offer context for a scenario and specifically show how stakeholders envision the solution. Use cases are helpful as a starting point for creating tests, including user acceptance tests. Use cases can be built and implemented iteratively. A use case diagram is not required when creating use cases, but it is a quick way to visually depict which actors are associated with multiple use cases and what the full scope of a use case is. See Section 4.10.7.5 for further information on use case diagrams.
- Relationship to requirements. Use cases typically are not standalone requirements but help to identify functional and nonfunctional requirements. During analysis, each step is analyzed to look for requirements to support the step. In particular, system steps will likely have requirements traced to them. Some organizations may choose to use the list of use cases to serve as the functional requirements bypassing the creation of a separate list of requirements statements. While this may save time, testing efforts are more difficult because traceability is not maintained at the requirement level. A failure of one functional requirement will cause the entire use case to fail. While use cases help to identify nonfunctional requirements, it is often preferred to document nonfunctional requirements external to a particular use case, because these often apply to the whole system.
4.10.8.3 User Story
A user story is a statement, written from the point of view of the user, and describes the functionality needed in a solution. Typically, a user story is used in an adaptive methodology, such as agile development, but can be used in any methodology approach. A user story often takes the format of:
As an <actor>, I want to be able to <function>, so that I can <business reason>.
Table 4-4. Example of Use Case
| Name | Find Recipe Items |
| ID | UC_001 |
| Description | A daily email with the featured recipe is sent to customers who have opted-in to the program. The customer opens the Recipe Box application directly on their iOS or Android device. The customer can choose a past recipe or use the current one. With a recipe chosen, the customer chooses a store or uses a store already indicated a “My Store.” A map of the store is displayed with an overlay showing the locations of the items for the recipe. |
| Actors | User (customer on a mobile app) |
| Organizational Benefits | Customer visits store to make purchases related to the recipe which are high-margin cooking items. |
| Triggers | Customer clicks on link in email on mobile device or directly opens application |
| Preconditions | Recipe Box application opened successfully |
| Post conditions | Customer views a map of the store with recipe items and locations indicated |
| Normal Flow |
|
| Alternate Flows | AF1—Local store not yet indicated
AF2—Local store not used (whether a “My Store” is chosen or not)
|
| Exception Flows | EX1—Selected store does not have an items for the recipe
EX2—No stores in zip code
|
The function provides a small discrete piece of business value or function. The elements of the INVEST acronym can be applied to all requirements, regardless of the format, to ensure quality of the user stories:
- Independent. Each story should stand alone, avoiding the creation of dependencies between stories, as much as possible.
- Negotiable. The story is subject to negotiation at all times regarding the content, priority, form, and function of the story, and becomes more concrete just before implementation.
- Valuable. The story only defines features or functions that are valuable to the business and that help solve the business problem.
- Estimable. The story should be clear enough to generate a valid estimate or lead to a discussion that will generate an estimate.
- Small. Stories should be small enough to be implemented, adding an increment of real value, within a single iteration.
- Testable. Each story should be independently verifiable.
When using user stories, acceptance criteria are provided that are used to confirm that the story is completed and working as expected. When a user story is too large to be completed in a single iteration, it is considered to be an epic. Epics are decomposed further into stories (or additional epics). Stories are used by the development team to build the product.
Example—Table 4-5 shows one epic and three related user stories. The epic describes what the user will get from this product and the user stories describe three specific types of activities the user should be able to do.
Table 4-5. Example of User Story
| Epic: As a customer, I want to go to the store and easily buy ingredients needed for a recipe. | |
| User Story | Acceptance Criteria |
| As a customer, I want to be able to find past recipes so I can prepare them again. |
1. Customer can search for past recipes 2. Search terms can be by recipe name, ingredient, or date 3. A search can return 0, 1, or many results 4. For one or many results, a user can choose a recipe from the list |
| As a customer, I want to select a store to purchase recipe ingredients so I can choose a store location that is close to me. |
1. Customer can enter a ZIP Code and get a list of stores in or near that ZIP Code, out to 20 miles from the ZIP Code 2. Customer can select a store from the list of stores 3. If no stores are found, the customer is informed |
| As a customer, I want to have a store map of where recipe ingredients are so I don't have to hunt for them. |
1. Customer has selected a recipe and a store 2. Customer is shown a map of the store with icons representing the recipe ingredients 3. Recipe icons can be selected by click or hover, and will show the ingredient name as well as the aisle and shelf location |
- Usage. User stories focus on what the user is looking to accomplish and are written from the user's perspective. They can be derived from process flows when the model is used. User stories are helpful on projects, because they are easy models for business stakeholders to engage in creating. In agile methodologies, user stories populate a backlog and are used as a basis for prioritizing future development. As user stories get closer to the top of the backlog, these should be elaborated using relevant modeling techniques to generate enough details for development to occur (known as “grooming the backlog”). Acceptance criteria should be developed at this time. For additional information on creating acceptance criteria, see Section 6 on Solution Evaluation.
- Relationship to requirements. A user story contains many requirements; therefore, it serves as a functional grouping of requirements. Stories can be traced directly to business objectives to substantiate the value of the requirements and can also be traced to elements in other models. User stories can be used to manage, prioritize, trace, and allocate functionality to releases and iterations. Although user stories are not detailed, they contain acceptance criteria and express user needs.
4.10.9 Rule Models
Rule models help to identify and document the business rules, business policies, and decision frameworks that need to be supported by the solution. Business rules are constraints about how the organization wants to operate and are usually enforced by data and/or processes and tend to be true over time. When analyzing business rules, the objective is to capture what should or should not be allowed in a business enterprise. An important aspect of analyzing business rules is identifying the source of a rule. A key element of business rules analysis is the absence of technology.
4.10.9.1 Business Rules Catalog
A business rules catalog is a table of business rules and related attributes. Common attributes to capture in a business rules catalog include a unique ID for the business rule, the rule description, and the type of business rule (there are multiple types of business rule classifications that can be followed), and references to other related documents. Business rules themselves are not processes or procedures, but rather describe how to constrain or support a behavior. Business rules apply across processes and procedures and guide the organization's activities. These rules should be written in plain language and each row should describe one rule. Business rules should not be nested and each should be able to stand independently. When creating business rules, the rules need to be correct, verifiable, and consistent. The catalog can be used to refer to related requirements or governance documents.
Example—The partial business rules catalog in Table 4-6 shows a few business rules for the recipe box. For example, only customers who have opted-in for emails will receive recipe box emails and that no personally identifiable information is allowed to be in the emails.

- Usage. Business rules should be maintained in a repository such as the business rules catalog. The rules need to be kept current and should be updated in the same manner as any other analysis model. The business rules catalog can be maintained at a level above an individual project, because business rules are often not specific to one project. Business rules catalogs can be traced to business objectives and other requirements types or analysis models in a traceability matrix to ensure that all business rules are captured. For example, decision trees help to identify business rules, so a mapping of business rules to decision trees would help to ensure completeness in this catalog.
- Relationship to requirements. It is common for business rules to be identified in the normal course of eliciting and analyzing requirements. These rules could lead to functional requirements that are necessary to support the business rules. Rules also emerge in discussions of functional requirements that involve decisions.
4.10.9.2 Decision Tree and Decision Table
Decision trees and decision tables depict a series of decisions and the outcomes they lead to. Decision trees and tables are often used to model business rules. Decision trees work best with binary choices (i.e., yes or no), and decision tables can be used when more choices exist and the analysis is becoming complex.
Decision trees are described in a tree of decision points where each branch represents a different choice. The far right of a decision tree (the leaves) represent the outcomes for a decision or series of decisions. Decision points in a decision tree are commonly represented as text at the branch points or in diamond shapes at the branch points. Decision outcomes are typically shown in boxes. Decision trees are drawn horizontally or vertically (with outcomes at the bottom).
Decision tables use a tabular format where the upper rows in the table represent the decision points and the bottom rows in the table represent the outcomes. Each decision point row enumerates a set of all valid choice combinations. A dash in the cell indicates that the choice does not matter in determining the outcome in that column. Each outcome row is marked to indicate which choice combination is valid. Each column of the table is a business rule that describes the set of choices for each decision point and the outcomes it leads to. When an outcome is unachievable, it is considered indifferent in a decision table.
The decision table consists of four areas as follows:
- Condition stub. Lists all of the possible conditions in the process or activity being analyzed.
- Conditions. Indicate which conditions are met.
- Action stub. Defines the possible actions as a result of the process or activity being analyzed.
- Actions. Indicate which actions are taken as a result of the conditions that are met.
Example—Figure 4-8 shows a sample decision tree for selecting a recipe in the mobile application. For example, if there is a store in range and if there is inventory for the items the shopper wants, and if the locations of the items are available, then the map can display item locations. Decision trees can be arrayed in different forms; below is one approach. Figure 4-9 represents the decision table for this decision logic.
- Usage. Both decision trees and decision tables are used to model complex branching logic. During elicitation or analysis, when a business analyst uncovers a series of “if this, then that” statements, either type of decision model is appropriate to use. Decision trees are helpful to identify ways to reduce complex decision logic by looking for redundancies in the structure. Decision tables are useful to ensure all possible combinations of decision choices are considered.
- Relationship to requirements. Decision trees and decision tables are used to identify and represent business rules. Both models stand alone as representations of the business rules because they can be implemented directly, as a process or in development. These models can also help to identify any requirements related to supporting those business rules or the specific outcomes.


4.10.10 Data Models
Data models document the data used in a process or system and its life cycle. These models are used to depict relationships between data, to show how data is related to processes, and to further help extract requirements and related business rules.
4.10.10.1 Entity Relationship Diagram
The entity relationship diagram (ERD), also called a business data diagram, shows the business data objects or pieces of information of interest in a project and the cardinality relationship between those objects. Business data objects are the conceptual pieces of data that the business thinks and cares about and are not intended to refer to exact data objects in a database. Business data objects represent the people, places, things, and concepts that the business cares about. Business data objects are shown as boxes, relationships as lines, and cardinality as labels on the lines. Multiplicity is indicated on the relationship line to represent the number of times (cardinality) that one entity occurs in relationship to the other entity in the relationship, and whether the relationship is required or optional. Cardinality is modeled in several ways, such as crow's foot notation or the 0 (none), 1 (single), and n (many) notation as shown in Figure 4-10. The method chosen is usually based on what the organization or business analyst is familiar with.

Some ERDs show the nature of the relationship between the objects as a text label on the line.
Example—In Figure 4-11, the entity relationship diagram shows four different objects and their relationships. For example, the customer may have zero or more recipes and will be able to obtain information from one store for a given recipe. The item location is specific to the store and would be captured as an attribute (in a data dictionary), but it is helpful to note that on this type of diagram.
- Usage. The entity relationship diagram is a cornerstone model for a project that has a data management component, because it helps with identifying the data that is created in, consumed by, or output from the system. This model is used to define the business data objects and their relationships to one another. The specific attributes of these objects are specified in a data dictionary.
- Relationship to requirements. Systems typically manipulate business data objects through functions to allow business data objects within an entity relationship diagram to be traced directly to requirements for these functions. The data objects can be traced to data flow diagrams, ecosystem maps, data dictionaries, and state transition models.

4.10.10.2 Data Flow Diagrams
A data flow diagram illustrates the relationships between systems, actors, and the data that is exchanged and manipulated over the course of one or many processes. It is a model that can be used after business data diagrams, process flows, and an ecosystem map have been created. In Figure 4-12, the data stores (shown as 2 parallel lines) show where information is conceptually stored, and the process steps (shown as circles) indicate which functions manipulate or use the data, and which external entities (shown as boxes) create data or consume data.
Example—The data flow diagram in Figure 4-12 shows that the customer selects a recipe and store, which are used in processes to map the store and overlay the ingredients on the map.
- Usage. A data flow diagram can be used to describe the movement of data between actors and systems over the course of a process or several processes. Data flow diagrams identify data inputs and outputs for processes, but do not specify the timing or sequence of operations.
- Relationship to requirements. Data flow diagrams relate to requirements through the business data objects and processes. While requirements can be traced to the model, it is better used as a tool to help stakeholders and developers understand how data flows through the systems, which then leads to identifying specific data requirements.
4.10.10.3 Data Dictionary
A data dictionary is a tabular format and shows data fields and attributes of those fields. Common attributes include name, description, size, and validation rules. However, any relevant attributes can be captured in a data dictionary.
Example—Figure 4-13 is part of a data dictionary and shows a few attributes for the recipe, store, and items. Business rules may be described in a data dictionary. For example, this data dictionary shows StoreNum is a 3 digit number that is required to be postive and one of the valid store numbers.
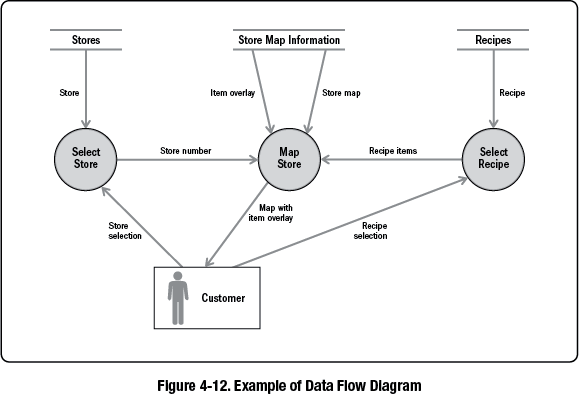

- Usage. Data dictionaries are used to specify very detailed aspects of data and to capture data fields and attributes from the business stakeholder's perspective. The information captured does not need to explicitly reflect a database design. However, database designers use data dictionaries as an input to create the database architecture.
- Relationship to requirements. Data dictionaries are used to capture very detailed requirements and their business rules. This model can stand alone and does not need redundant requirements statements.
4.10.10.4 State Table and State Diagram
State tables and state diagrams model the valid states of an object and any allowed transitions between those states. State tables are in a tabular format with all of the valid states in the first column and across the first row. Each cell represents the transition from the state in the row to the state in the column. Transitions that are not allowed have cells that are marked with “X,” “N/A” or “no.” Allowed transitions are represented in cells with either “yes” or a description of the transition event that leads to the transition. State diagrams show exactly the same information as state tables, but it is easier to visualize the valid states and transitions by showing only the allowed transitions. Ovals are used for states, and lines with arrows show the transitions and transition events between states. Some state diagrams are drawn by showing an initiation state and a termination state.
Example—Figure 4-14 is an example of a state table for the states of a recipe, and Figure 4-15 is the state diagram for the exact same scenario. Notice that the states and transitions are the same in both figures; either model may be used to show the same information. Both models show that a reviewed recipe can move to either a rejected or published state. The state diagram makes it easier to see how a recipe moves from drafted to reviewed to published states.

- Usage. State tables and state diagrams help business analysts specify the life cycle of an object in the solution. For example, objects that go through workflow (e.g., an approval process) are aided by using state models. State tables are useful to ensure that state transitions are not missed, because every possible transition is represented by a cell in the table; when every cell in the life cycle is considered, no transitions can be forgotten. It is more difficult to ensure that state diagrams are complete, but much easier to quickly visualize the life cycle of an object.
- Relationship to requirements. State table and state diagrams are models that stand alone and do not require additional requirements statements to be developed and tested correctly. The exception to this is when the transition events are too complicated to fit in the cell or on the arrow, in which case, additional detail is included outside of the model. State tables are also used to confirm or find gaps in data and processes that have been specified by other models and are used often to model business rules.

4.10.11 Interface Models
Interface models depict the relationships within a solution to gain an understanding of which interfaces there are and the details of those interfaces.
4.10.11.1 Report Table
A report table is a model that captures the detailed level requirements for a single report. Common attributes of a report include: name, description, decisions made from the report, objectives, audience, trigger, data fields, data volume, frequency, display format, and calculations. These attributes should be specified alongside a prototype or example of the actual report, when possible, because it adds context for the textual information in the report table. While it is not necessary to complete all fields, the fields can be used to help identify what to think about when eliciting reporting requirements.
Example—Figure 4-16 shows a prototype of the Mobile App Usage Report and Figures 4-17 and 4-18 show the report table model (the model is split into two figures here for sizing but is typically one table). Fig 4-16 provides data for each store on the number of transactions, number of products per transaction, new mobile application downloads, and recipe uploads. This information allows the sales and marketing department to establish a correlation between the mobile app and recipe feature and the actual changes in the average number of products purchased in each transaction. There are many different types of report table templates. This is one example and provides one sample of the type of information that could be placed in a report table model.


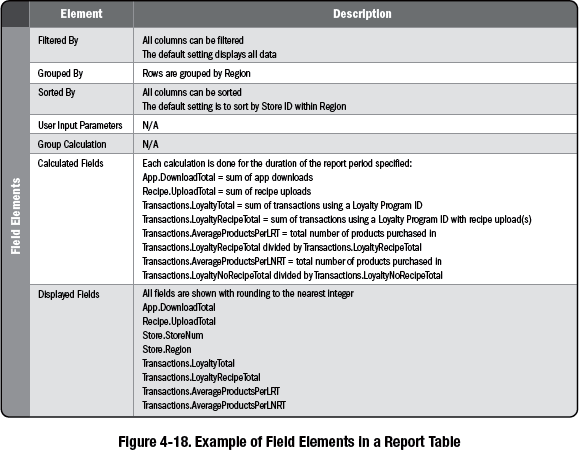
- Usage. Report tables are straightforward, can be created for each report, and are helpful to provide additional details about reports that cannot be gleaned by looking at a mockup. Using a report table with attributes allows the business analyst to specify the type of information to be included in the reports, thereby ensuring that details are not forgotten or overlooked in the solution. When report data has multiple sources, the business analyst needs to define the system of record. The answer may require either a business or a technical decision. When mockup tools are available, teams may choose to use the tool instead of using the table. The business analyst should make sure the tool provides all of the same opportunities to capture requirements as are provided by the report table. Missing these opportunities can result in missed requirements.
- Relationship to requirements. The information in a report table model represents the actual report requirements; therefore, no additional requirements are necessary. Stakeholders can use the report table and a mockup of the report to fully understand the report requirements.
4.10.11.2 System Interface Table
A system interface table is a model of attributes that captures all of the detailed level requirements for a single system interface. The system interface table is in a tabular format and typically includes attributes such as source system, target system, volume of data passed, security or other rules, and the actual data objects passed.
Example—Table 4-7 is an example of a system interface table for the interface between the grocery store and the customer's mobile device. This system interface table specifies that information about the store and recipes are synced daily from the store to the mobile device.

- Usage. System interface tables are used to specify the details for each interface between the systems in the solution. Typically these tables specify requirements for both the source and/or target system, but it could be only one of these. The attributes of a system interface table ensure that details about the interface are not forgotten.
- Relationship to requirements. System interface tables are detailed enough to represent the actual interface requirements and do not need to have other requirements written.
4.10.11.3 User Interface Flow
A user interface flow displays specific pages or screens within a functional design and plots out how to navigate the screens according to various triggers. The boxes in this diagram are the main screens in the user interface. The lines show the flows allowed between screens.
Example—Figure 4-19 is a user interface flow that shows the transition between the screens in the mobile application. For example, a user can move from the login screen to the register screen to the search recipe screen, or directly from the login screen to the search screen.

- Usage. Typically, user interface flows are used in the solution definition stage of a project and help track all of the screens that need to be further defined. This model is applicable only when there is a user interface as part of a solution. Interface flows can be used during elicitation sessions to determine more details about the functions that take users between the screens.
- Relationship to requirements. This model does not reflect individual requirements statements. The user interface flow can be traced to other requirements models such as the display-action-response models, process flows, and individual requirements.
4.10.11.4 Wireframes and Display-Action-Response
The display-action-response model is used in conjunction with wireframes or screen mockups to identify page elements and the functions, if any, they are attached to. Each wireframe is broken down into user interface elements, which are then described from a display perspective and a behavior perspective. A user interface (UI) element table is created for every element on the screen that has user interface requirements. Each table describes the user interface element's display requirements under different preconditions and behavior requirements under different preconditions and user actions.
While this type of user interface analysis is sometimes performed by user experience analysts or human factors experts, the business analyst is often called upon to perform this function. In general, user interface analysis focuses on profiles of the users who interact with the system, and precedes interface design. The business analyst, working in conjunction with the user experience analyst when one is assigned, analyzes the user interfaces to see how well these interfaces meet the general principles of human-machine interface:
- Compatibility. Minimize the amount of information recoding that will be necessary for operators/users (Write Once, Read Anywhere).
- Consistency. Minimize the difference in dialog both within and across various human computer interfaces; follow a user interface standard such as common user access (CUA).
- Memory. Minimize the amount of information that users need to maintain in short-term memory (use reference tables or default information to prefill forms).
- Structure. Show users the structure of the system so that they are able to navigate through the interface intuitively (effective grouping of similar data elements).
- Feedback. Provide users with feedback and error correction capabilities (something happens on the interface every half second).
- Workload. Keep user mental workload within acceptable limits.
- Individualization. Allow customization of the interface to determine the requirements for individualization.
Collaboration Point—Because the information elicited is complementary, the user interface analyst and business analyst should work together to support each other when eliciting requirements.
Example—Figure 4-20 shows a simple wireframe mockup of the login screen. Figure 4-21 shows one display-action-response model for the screen, specifically the display and behavior requirements for the password button. This model specifies requirements to the level of what gets displayed when the user types their password (privacy dots) or what happens when the user selects a field (keyboard appears).
- Usage. This model is helpful when there is a user interface for a solution. The display-action response model is typically used when precision is needed for detailing the display and interactions in a user interface. This could occur when defining user interfaces for a large number of users, high-risk user interfaces, or when a development team is unfamiliar with the product. These models are helpful for specifying user interface requirements because the model places the individual requirements statements in the context of the elements on the screen.
- Relationship to requirements. Display-action response models trace directly to wireframes, user stories, user interface flows, and data dictionaries. These models contain user interface requirements and do not need further specification.
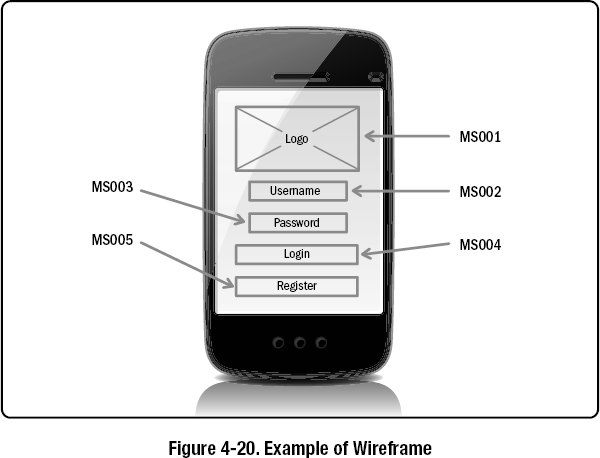

4.11 Document the Solution Requirements
After analyzing all of the information that has been elicited, the business analyst documents the resulting requirements in one of many forms, depending on the organization, the project needs, and the project life cycle being used. Regardless of the form the requirements take, when packaged together, a set of requirements defines the solution scope to the business problem or opportunity. The business analyst prepares the requirements package so that the solution team understands how to develop the solution. Documentation can be produced in various levels of formality and in many forms, and is often dependent on the selected project life cycle. The solution may not be the complete solution, as in the case of a project following an adaptive project life cycle, but it should represent the solution based on the information available at that point in time.
4.11.1 Why Documentation is Important
Documented requirements serve a multitude of purposes, such as the following:
- Baseline to validate the stakeholder needs;
- Baseline definition of the solution for the business problem or opportunity;
- Primary input to the design team, the developers, testers, and quality assurance;
- Basis for user manuals and other documentation whether written or embedded;
- Supporting detail for contractual agreements, when applicable (e.g., the requirements are a core input to a statement of work (SOW) for a request for proposal (RFP));
- Starting point for the evolution of the solution;
- Foundation for reusability by other project teams who need an understanding of the project details while it is in process or after implementation; and
- Baseline for an audit of regulated industries and high-risk projects that are required to have documented requirements.
Despite the importance of documenting the requirements, keep some factors in mind about requirements documentation:
- Requirements documentation is only one of several techniques to ensure consensus among all of the stakeholders as to the behavior of the solution.
- Documentation should not replace communication and collaboration.
4.11.2 Business Requirements Document
Business requirements are the goals, objectives, and higher-level needs of the organization and provide the rationale for a new project. Business requirements recognize what is critical to the business and why it is critical before defining a solution.
In some organizations, a business requirement is considered to be the high-level requirement, for which user or stakeholder requirements are then used to document the solution. Other organizations use the term business requirements to refer to any requirement that is not a system or technical requirement. Business requirements may be assembled in a business requirements specification or may be part of a larger document that contains all of the requirements. Organizations that use spreadsheets to capture requirements may use a hierarchical structure, with the business requirement as the starting point. In a requirements management tool, business requirements are often grouped by assigning a category or attribute.
4.11.3 The Solution Documentation
Solution documentation is the documentation that is comprised of the features, functions, and characteristics of the product or service that will be built to meet the business and stakeholder requirements. The work of the solution development team is heavily dependent on the solution documentation, because it serves as the blueprint for the product that the solution team is being asked to build. When development work is outsourced, it is essential for the solution documentation to be precise and detailed, because the outsourced team often lacks the business knowledge that an internal development team has. The business stakeholders have a role to review, validate, and approve the solution documentation. The level of formality for these processes is dependent on the selected project life cycle.
The solution documentation may be rendered in any number of forms. Some common forms include:
- Requirements document, which may be a business requirements document and/or a functional requirements specification and/or a system or software requirements specification, etc.;
- Deck of user stories written;
- Set of use cases with accompanying nonfunctional requirements; or
- List of items on a product backlog.
The format of the solution documentation is defined in business analysis planning.
4.11.3.1 Requirements
Product requirements are written at different levels of detail and are associated with different requirement types, for example, business, stakeholder, solution, and transition requirements, where solution requirements are further categorized as functional and nonfunctional. Within any of these types, requirements can be written into progressive levels of detail, and when this occurs, these can be documented in a hierarchy or with a numbering convention that demonstrates the hierarchical progression.
While product requirements describe what is being built or the outcome of the project or solution to the business problem, project requirements describe the constraints and necessities for successful completion of the project.
Example—For example, product requirements describe the length and width of the sidewalk to be constructed in front of a building, along with such aspects as color and texture. The project requirements for laying the sidewalk could include the number of laborers required, qualifications of the laborers to handle the equipment, size of the equipment, time frame for usage, and any restrictions on labor hours.
Collaboration Point—Product requirements are the responsibility of the business analyst. Project requirements are the responsibility of the project manager.
4.11.3.2 Categorization
Requirement categories are used to help group and structure requirements within the documentation. The requirement categories may be determined before starting the documentation effort or the requirements may be documented first and then the categories decided after. When choosing the categories later, they can be determined based on the actual information gathered. Selecting the categories earlier may provide a structure for use in organizing how to elicit information from stakeholders.
The process of categorization helps expose vague, misstated, ambiguous, or otherwise poorly written requirements. When the business analyst is unable to place information or a requirement in a category, the requirement is likely to be invalid and may need to be revised, expanded, or removed. Categorization used in this way filters out the bad or poorly written requirements.
Examples of possible filters are:
- Scope filter. Determine whether a requirement or information is in scope, out of scope, or unknown. Unknown refers to requirements that are possibly invalid and need to be revised or omitted.
- Functional filter. Once the functional categories have been determined, any defined functional requirement not fitting into one of the categories can be filtered out, revised, or discarded.
- Prioritization filter. An arbitrary level of priority (e.g., needs, wants, and desires), is defined and used as a filter to determine which requirements stay or are removed.
- Testability filter. All requirements need to be testable, and all requirements should be examined to determine if they are testable. Any requirements that are not testable are filtered out and need to be revised.
Note: Filters may indicate the need for an additional classification, implying that the original list of filter elements is incomplete.
4.11.4 Requirements Specification
The requirements specification is a common form for documenting requirements. The requirements specification attempts to specify all circumstances, conditions, actions, reactions, results, and error conditions that could possibly occur in the defined solution. The concept is to create a manual that is followed by the development team to create the solution. Many books have been written on the subject of how to construct a requirements specification, and how the individual requirements within that specification should be written. There are several available standards that can be followed. Each attempts to circumscribe the contents and form of the requirements specification.
Requirements specification is a generic term that includes all documents that contain requirements. These requirements may be high-level, business-oriented wants and needs, or very detailed specifications required to build the new product or service.
Formal requirements specifications are more lightweight on projects using agile, lean, or hybrid methods. These teams may produce a one- to two-page specification and may include user acceptance testing and trace matrices to holistically describe the product.
4.11.4.1 Documenting Assumptions
An assumption is a factor that is considered to be true, real, or certain, without proof or demonstration. Analysis starts with assumptions and these assumptions are either proven or disproven over the course of a project. There are many situations where assumptions are valid and warranted such as:
- Complete information is unavailable; for example, the business analyst assumes that the technical resources to implement the solution will be available when needed.
- The success of the project is dependent upon something happening in the future; for example, an increase in customer population, or a change in consumer interest.
- Assumptions are made based on factors that exist currently, but those factors may not exist in the future. The common assumption about a project, for example, is that all members of the team will stay on the project until the project is completed. The longer the project, the less likely that this assumption is true.
While assumptions may not hold true over the course of the entire project, they impose a level of risk. The business analyst identifies a contingency for each documented assumption so there is a course of action should that assumption turn out to be false. Assumptions, once documented, should be monitored by the business analyst and project manager. As the project progresses and more information is known, assumptions may be deemed invalid or not relevant. When this occurs, the assumption is closed and a reason is provided as to why the assumption is no longer valid.
4.11.4.2 Documenting Constraints
The project management view of a constraint is that it is a limiting factor that affects the execution of a project, program, portfolio, or process. In business analysis, a constraint is a limiting factor placed on the product or solution. Therefore, there are two levels of constraints: product or solution constraints and project constraints.
Collaboration Point—The business analyst is primarily concerned with the product or solution constraints, although frequently project constraints are voiced by stakeholders during elicitation. Therefore project constraints are documented by the business analyst and passed along to the project manager for follow-up.
While some consider all requirements to be constraints on the solution because both constraints and requirements need to be met, solution constraints are often treated as a specific category of requirement. Constraints are considered by some to be a form of nonfunctional requirements, while others prefer to think of nonfunctional requirements as the origin of some design or implementation constraints.
The difference between constraints and requirements is that requirements are written in the positive voice, because they define something that should be done. Requirements should not state that something not be done. While requirements define the solution by stating the “what,” solution constraints are typically written in negative or constraining language and limit the solution by stating actions that cannot be performed. These constraints are placing limitations on how the problem described by the requirements is solved. Solution constraints are best highlighted by being placed in a separate and distinct section of the requirements document.
Solution constraints may fall into a few specific categories:
- Geography,
- Regulations,
- Organizational policy, and
- Culture.
Some examples of solution constraints are:
- Restricting access to sales information to the region that the customer is located in (geography),
- Prohibition against using certain building materials (regulation),
- Security restrictions preventing the use of certain data or systems by unauthorized personnel (policy), or
- Limitations on the amount of change that the organization can withstand over any period of time (culture).
Project constraints may include:
- Direction to use predetermined equipment, organizational standards, or a preferred supplier;
- Restrictions, such as resource utilization, message size and timing, software size, maximum number of and size of files, records, and data elements; or
- Time (deadline), cost (budget), and scope.
4.11.5 Guidelines for Writing Requirements
Information needs to be transcribed into high-quality, well-formatted requirements. Requirements that are well written are of higher value to the solution developer and overall project team, because these will be clear, concise, and reduce conflict and confusion on what needs to be delivered.
How requirements are written and documented and the guidelines that help structure them are dependent on the selected project life cycle. Requirements are often written in a text-based format when developing business requirement documentation or solution requirement documents, and written in the format of user stories for projects that follow an adaptive life cycle. The guidelines for both formats are presented here. Requirements can be more than text and may also take a visual form as well.
4.11.5.1 Functional Requirements
A well-formatted requirement consists of the following elements:
- Condition,
- Subject,
- Imperative,
- Active verb,
- Object,
- Business rule (optional), and
- Outcome (optional).
Example—A well-formed detail level requirement might be as follows: When the new account button is pressed (condition), the system (subject) will (imperative) display (active verb) the new account entry screen (object) allowing the creation of a new account (outcome).
The following characteristics serve as a checklist when reviewing requirements to ensure they are of high quality. The guidelines address the writing and not the format of the requirement and are applicable to any format or rendering of the solution document. The following characteristics are present in all requirements when they are of a high level of quality:
- Unambiguous. Clarity is key; therefore, the business analyst should take steps to ensure that the written requirements are not ambiguous. When two individuals disagree on the meaning of a requirement or when an individual interprets a requirement differently from its intended meaning, then the requirement is ambiguous. The requirement needs to be rewritten to remove the ambiguity. If the requirement is not clear before requirements are baselined, stakeholders may have different interpretations of the requirements. Ambiguity may result in the solution team building the wrong solution component, and others who base their work from the requirement as stated may perform their work incorrectly. A written requirement should be reviewed to see if it can be stated in a simpler or more straightforward manner (see Table 4-8).
- Precise. As a whole, the solution document states precisely what the solution to the business problem is—no more, no less. Precision also refers to choosing the right words. With adaptive life cycle methods, the business analyst should specify at what point the requirement will need to be precise, as the requirements will unfold into details through incremental elaboration; therefore, it is understood early on that all details may not be known. See Table 4-9 for examples of precise and imprecise language.
Table 4-8. Example of Ambiguous vs. Unambiguous Requirements
Note: This requirement construct is in a format that would be used for text-based requirements written for a project following a predictive life cycle. Adaptive life cycle projects may use user stories and use cases and use a different format.
| Ambiguous Requirements | Unambiguous Requirements |
| The system shall check the name field to be only alphabetic and the address field to be either alphabetic or numeric but containing only addresses in the U.S. or Canada, and the quantity field to be only numeric |
3.4.1 The system shall validate that 3.4.1.1 The name field is alphabetic 3.4.1.2 The address field is either alphabetic or numeric 3.4.1.3 All addresses are in the U.S. or Canada only 3.4.1.4 The quantity field is numeric only |
| The system provides identification of the employee when passing through the reader | 3.9.12 When the employee passes through the reader, the system displays the photograph of the employee on the monitor |
Table 4-9. Examples of Precise and Imprecise Language
Note: In this example, precision is obtained by specifying a business rule that is best maintained in a business repository and not hard-coded within the software.
| Imprecise | Precise |
| 9.2.1 When the department code entered does not match the department code on file, the system will display an error message. | 9.2.1 When the department code entered does not match the department code on file, the system will display “invalid department code.” |
Table 4-10. Examples of Inconsistent and Consistent Language
| Inconsistent | Consistent |
| 17.1.4 The security system will | 17.1.4 The security system will |
| 22.4.9 The new security system will | 22.4.9 The security system will |
| 33.9.11 The secure card system will | 33.9.11 The security system will |
| 34.12.12 The R/F security system will | 34.12.12 The security system will |
- Consistent. Each requirement should be included one time in the solution document to avoid contradiction and redundancy. The requirements should not be in conflict with other requirements within the documentation set. The language needs to be consistent throughout. The business analyst maintains consistency through rewrites, revisions, changes, and modifications to the solution document. These revisions occur naturally in the iterative nature of business analysis. As more information is uncovered during elicitation, the business analyst analyzes it and incorporates it into the documentation. A traceability matrix helps to ensure consistency. Traceability is used to verify consistency and is achieved when determining the relationships between requirements. Traceability and the traceability matrix are discussed in detail in Section 5 on Traceability and Monitoring.
Conflicting requirements are not unusual when there are multiple business analysts working on the same set of requirements and performing elicitation separately. One way to prevent contradicting requirements is to assign only one business analyst the responsibility for writing the finished document. Inconsistencies are also introduced in requirements when multiple terms are used to mean the same thing. For example, when referring to the result of the project as the “new system,” the new “accounts payable system,” and the “financial system” within the same set of documentation; those reading will assume that the document refers to three different systems. Even though it may be repetitive to use the same terminology, it ensures consistent and unambiguous requirements. See Table 4-10 for examples addressing consistent language.
Contradictions occur when stakeholders have opposing requirements. For example, two different business units or constituencies may each want their own requirements regardless of how their requirement may impact another stakeholder group. There are a few ways of resolving this particular situation:- The most direct route is to bring the contradicting parties together in the same room and have them work through the inconsistency.
- Information can be added to one requirement, which details special circumstances that remove the contradiction.
Table 4-11. Examples of Correct and Incorrect Inclusion of Requirements
| Incorrect | Correct |
| 7.0 Security | 7.0 Security |
| 7.7.1 The password will be at least 8 characters in length | 7.7.1 The password will be 8 characters in length |
| 11.0 User interface | 11.0 User interface |
| 11.9.13 The password will be no less than 8 characters in length | 11.9.13 The password length is defined in section 7.7.1 |
- It may be necessary to support both requirements; in these cases, requirements for each user group are captured in the form of stakeholder requirements.
Example—For example, when one business unit requires 4000 transactions per day and another business unit requires 2000 transactions per day, the requirement will be consistent if stated that 4000 transactions a day are required during the holiday season from October to December 31, and 2000 transactions a day are required for the remainder of the year. The requirement may be rewritten to add more clarity such as: 4000 transactions a day are desired, but 2000 transactions a day are mandatory.
Within a single software requirements specification, it is possible to introduce ambiguity by repeating information. When requirements are repeated, there is a risk that a change is reflected in one requirement and left unchanged in the duplicated one. One way to avoid ambiguity incurred through redundancy is to remove the redundancy (see Table 4-11 for an example).
- Correct. Each requirement should accurately describe the functionality to be built. Correctness is not absolute; the solution document is only as correct as the information that has been obtained up to that point. As more information is uncovered, adding new information makes the solution document more correct by removing some assumptions, clarifying ambiguities, and adding new information in a progressive, elaborative approach.
The following basic rules help to ensure correct requirements:
- Only the product stakeholder can confirm that a requirement is correct. Correctness is established through frequent review and confirmation sessions with the sources of information. Correctness is the purview of the business community.
- In general, no single requirement should be committed to the solution document until it has been confirmed by a second source. In the case of requirements documentation, the second source may be another individual from the business community, or a different way of gathering information (e.g., gathering information about a process through observation and then interviewing the process workers who have been observed for confirmation on what has been seen).
- Complete. Completeness is also not absolute. The requirements can be made more complete with more information. Therefore, the guidelines that apply to correctness also apply to completeness. The business analyst should ensure that enough information is gathered and documented to complete the requirement; however, too much information makes the requirement difficult to follow and convey.
Guidelines concerning requirements completeness are as follows:
Table 4-12. Examples of Complete and Incomplete Requirements
| Incomplete | Complete |
| The card reader shall be of the same dimensions as indicated by the card size and consistent with industry standards | 54.1 Card reader dimensions TBD by April 3 (by John Doe, Security Architect) |
| Terminate a session after the number of incorrect passwords exceeds the maximum allowed | 24.2.2 Terminate a session after the 3 incorrect passwords have been entered |
Table 4-13. Examples of Measurable and Not Measurable Requirements
| Not Measurable | Measurable |
| There will be no more than 6 training classes per employee | Each employee will have not less than 2 and no more than 6 training classes residing on their professional development profile |
| The new production line shall be efficient | The new production line shall produce an average of 5000 bottle caps per day |
- Document all known requirements, especially those that are confirmed by the stakeholders. This includes all conditions that apply to a requirement.
- Include in each requirement all of the information necessary for the solution team to design, build, and test the solution component. A requirement is said to be “self-contained” when this is true.
A requirements specification is complete when it contains the following (see also Table 4-12):
- All necessary requirements,
- Responses specified for all inputs,
- Requirements that produce all necessary outputs, and
- Labels and references to all figures, tables, and diagrams.
Note: What constitutes completeness is dependent on the selected project life cycle.
Because of necessary assumptions, requirements may exist in an incomplete form. Use of the term “to be determined (TBD)” is acceptable for use provided there is a date when the information is to be determined and, optionally, the name of the person who is responsible for determining it. These should be resolved for a given portion of the requirements before proceeding with construction.
- Measurable. Each requirement needs to be independently measurable. A requirement that is measurable provides the necessary detail to understand the criteria for testing. Measurability is usually a prerequisite to testability; a requirement that is not measurable cannot be tested (see Table 4-13 for examples).
- Feasible. Feasibility was discussed in detail in Section 2 on Needs Assessment. The focus of the feasibility analysis performed at the forefront of the business analysis work pertains to the work to determine the feasibility of various solution options. The feasibility discussed in requirements elicitation and analysis pertains to the feasibility of each requirement. Feasibility here is conducted at a much more specific and detailed level.
The same categories of feasibility used in the needs assessment when evaluating a solution option can be applied here to evaluate the feasibility of a requirement. For example:
- Operational feasibility. When the solution requirement is met, will the implementation of it within the solution be supported by all stakeholders who use the new product or solution? Ensure a solution requirement for one stakeholder group does not make the use of the product inefficient or unusable to another stakeholder group.
- Technology/system feasibility. Can the requirement be fulfilled based on the technologies that have been selected for the solution? While the solution as a whole was assessed for technical feasibility, the focus here is on each specific requirement. Involve the solution development team to ensure that each requirement is technically feasible. Technical feasibility is more easily kept in check with adaptive project life cycles because the project team is working on a small amount of the solution at a time and is collaborating daily, whereas with the predictive life cycles, there is a risk that the business analyst is not interacting with the solution development team often enough. When following a predictive or iterative life cycle, ensure requirements are evaluated for feasibility by the solution development team before they are baselined. Business stakeholders will be more disappointed to be informed late in the process that a highly desired requirement was not technically feasible than learning about it early in the process when the requirement was provided.
- Cost-effectiveness feasibility. Does the cost to fulfill the requirement make sense with respect to the value the requirement will deliver to the business? Cost may be one of the requirement attributes that is being tracked. Work with the solution development team, business stakeholders, and the project manager to ensure the cost-effectiveness of each requirement is analyzed. A requirement makes sense when the value it provides is greater than the cost to implement it.
- Time feasibility. Can the defined requirement be met within the time allocated for the project phase or should the feature be considered for a future release? A project delay may occur from a single requirement; therefore, it is better to know up-front when a requirement will require a level of effort by the solution development team that exceeds the time allocation for the entire development phase.
There is no one single factor such as time or cost that determines the feasibility of a solution option or evaluates the feasibility of a requirement. Feasibility is best analyzed according to a variety of factors.
- Traceable. Traceable requirements are those that can be mapped back to the source of the requirement and mapped forward through the development life cycle to a test case that proves that the requirement was successfully satisfied. Requirements may also be traced between requirements and back to business goals, objectives, and higher level requirements.
It is important to be able to trace any given requirement back to a source in the event that there are changes to the requirement or other changes that impact the requirement. The business analyst uses the source to identify who to contact when the requirement changes.
Within predictive life cycle projects, from a project management perspective, traceability provides a fairly accurate estimate of the level of completion for development. When all of the requirements can be traced to test cases through design and build, the percent complete, and more importantly what remains to be completed can be determined by the number of test cases that have been successfully executed. When 100% of the test cases have been executed, then 100% of the requirements have been satisfied, at least in the build phase. Traceability is further discussed in Section 5 on Traceability and Monitoring.
- Testable. Requirements should be written in a way that allows them to be tested. When a requirement is not testable, it is typically because the requirement is vague, unclear, ambiguous, or has violated some other principles or writing guidelines for quality requirements. Testable requirements allow for an assessment of pass/fail. If the requirement is written to be measurable, then the requirement can be tested.
Confirming the testability of a requirement does not mean creating or writing the test case for execution during the test stage. Confirm only that a test can be created to verify that the requirement has been satisfied. Sometimes the evaluation criteria are constructed in the case of the development of user stories. For more information on the evaluation activities performed for solution validation, see Section 6 on Solution Evaluation.
4.11.6 Prioritizing Requirements
How requirements are prioritized should be fully defined in the business analysis plan. Section 3 on Business Analysis Planning discusses the criteria that the project team may use to prioritize the product requirements. The business analysis work in requirements elicitation and analysis is performed to use one or more prioritization techniques in order to facilitate priority decisions from the key stakeholders. The key stakeholders here are those stakeholders who have the authority to prioritize requirements as specified during planning.
4.11.6.1 Prioritization Schemes
There are several methods to evoke prioritization of requirements from the stakeholder community. Many business stakeholders may find it difficult to make decisions regarding prioritization, as they may see all of the requirements as equal, or at least the requirements they provided. Drive the prioritization decisions from the business by using one or more of the following techniques to help support the prioritization activity:
- MoSCoW. MoSCow establishes a set of prioritization rules which are:
- Must haves (fundamental to project success),
- Should haves (important, but the project success does not rely on them),
- Could haves (can easily be left out without impacting the project), and
- Won't haves (not delivered this time around).
- Multivoting. There are many forms of multivoting that are designed to gain active participation from stakeholders. This technique provides a process for participants to apply votes to a list of items to determine an answer based on number of votes received. When using multivoting for setting priorities, the requirement with the most votes is deemed the higher priority item.
Example—When applying multivoting to determine a list of prioritized requirements, each stakeholder could be given a set of sticky dots in three different colors: red for high priority, blue for middle priority, and yellow for low priority. With the requirements on a whiteboard or flipchart, the stakeholders place one or more of their sticky dots next to the requirement they believe merits the priority. A participant can place all of the red sticky dots next to a requirement believed to be of the highest priority. Once all the dots have been placed, the dots are totaled and the requirements prioritized. The game-like atmosphere of this approach makes it easy and fun for stakeholders to prioritize requirements.
- Time-boxing. Time-boxing is a prioritization technique that is used when the project has a fixed timeline and the timeline is not negotiable. Time-boxing approaches the prioritization of requirements by analyzing the amount of work the project team is capable of delivering during a prescribed period of time. The project team determines the scope based on what work can be completed within the fixed window of time. If the time-box is 90 days, the project team evaluates the list of requirements and determines what can be delivered within that 90-day window. Time-boxing is often used with other prioritization techniques, such as MoSCoW, to ensure that the requirements time-boxed into the product release are those the business has selected as the highest priority or highest valued. A variation of this technique uses money instead of time to determine which requirements can be delivered based on a budget.
- Weighted ranking. Weighted ranking begins in business analysis planning before the possible solution options are listed. Prior to performing weighted ranking, the business analyst facilitates a decision regarding which criteria the decisions will be based on. Possible options are efficiency, ease-of-use, attractiveness, etc. Once a short list of criteria has been selected, the criteria are ranked with a score. The highest score is assigned to the criterion considered to be most important, thereby creating the weighted rankings. Weighted ranking is further defined in Section 2 on Needs Assessment where it is used to rank solution options.
4.11.7 Technical Requirements Specification
Projects may require more detailed technical documents (e.g., software IT, construction, manufacturing projects to name a few). The requirements are documented in the format of a technical requirement specification.
Technical specifications may contain such elements as:
- Wireframes describing the appearance of a user interface,
- Screen mockups specifying the details of a user interface screen,
- Data models and schema,
- Detail process flows such as data flow diagrams or activity diagrams, and
- Detailed requirements that include technical references.
Collaboration Point—For IT projects, some organizations have a systems analyst who produces the technical specification, dividing the requirements documentation between the business analyst and the IT analyst. The business analyst then produces the business requirements specification and the systems analyst prepares the technical requirements specification. In this practice guide, the role of business analyst is referred to in the general sense; therefore, the work to produce the technical requirements specification is included as a possible documentation activity, recognizing that the documents that are produced will be dependent on the selected project life cycle.
4.11.8 Documenting with Use Cases
Use cases may be used by an organization in addition to a functional requirements specification or used instead of producing a separate functional requirements specification. A use case may represent one or more functional requirements. Use cases may supplement text-based requirements and are developed for areas of the system where the interaction of the system and the user are more complex. Use cases may be used when there are multiple paths and scenarios that the system needs to accommodate. Instead of creating a functional requirements specification, some organizations may decide to use cases and will choose to use models, such as those discussed in this practice guide, instead of text-based requirements. The decisions regarding the preferred documentation approach for the project is made in business analysis planning. Use cases are explained in Sections 4.10.7.5 and 4.10.8.2.
4.11.9 Documenting with User Stories
A documented user story is sometimes written on an index card. Writing the story on a card enforces brevity and concision. When cards are not used, maintain the stories in a document, spreadsheet, or requirements management tool. When packaged together, user stories represent a high-level version of solution requirements. User stories are a documentation method for breaking down features into manageable parts and provide a simple and effective mechanism to segment a complex set of features into simple, definable elements. User stories are explained in Section 4.10.8.3.
4.11.10 Backlog Items
A backlog is a prioritized listing of product requirements and deliverables to be completed, often written stories, and prioritized by the business to manage and organize the project's work. As the use of adaptive project life cycles has become more prevalent, the concept of building a backlog has gained in popularity and across approaches. Where backlogs are commonly leveraged to contain only user stories, the term can be used more broadly as backlogs may contain use cases, requirements, and defects to be fixed, in addition to the user stories. Regardless of the content stored in the product backlog, to ensure clarity, each item should be written with the same care and follow the same guidelines as a requirement expressed in a business requirements document.
In agile approaches, the business analyst is often assigned to help the product owner groom the product backlog, which involves adding and removing backlog items and reprioritizing based on changing business conditions and priorities.
4.12 Validate Requirements
Validation is defined as the assurance that a product, service, or system meets the needs of the customer and other identified stakeholders. In business analysis, requirements validation is the process of ensuring all requirements accurately reflect the intent of the stakeholder; thereby ensuring the requirements meet their expectations.
4.12.1 The Concept of Continual Confirmation
Confirmation of requirements can occur whether the requirements are written down in a requirements document or are displayed on a whiteboard in a requirements workshop. Confirmation is not an activity that is performed once at the end of the requirements process. Confirmation occurs whenever the business analyst reviews the information gathered during an elicitation session with the stakeholder or any part of the developing solution is shown to the stakeholder. Confirmation is not approval—only authorized stakeholders can approve. Confirmation means obtaining agreement from the stakeholders that the solution under development is good and will accomplish the objectives.
It is helpful to demonstrate parts of the solution as it is being completed. It is easier to obtain low-level confirmation on a continuing basis than to try to have the entire solution document confirmed and approved at the same time. When the requirements are broken up into small, self-contained units, the review sessions involve fewer participants and take less time.
It may also be helpful to divide the requirements document up by functional area and ask stakeholders to confirm the requirements that impact their area. This requires more work, but stakeholders will appreciate being able to focus specifically on their own requirements. There is a risk, however, that the separation of requirements may not be correct, and stakeholders impacted by a group of requirements may not be provided with all of the requirements that will impact them.
4.12.2 Requirements Walkthrough
Requirements walkthroughs are used to review the requirements with the stakeholders and to receive confirmation that the requirements as stated are valid. Valid requirements accurately reflect what the stakeholders are asking the solution developers to develop.
To conduct a requirements walkthrough, the business analyst schedules the session providing the stakeholders enough time to prepare. Reviewers may be asked to read the materials before attending and, by doing so, the reviewers will be able to:
- Think about the stated solution ahead of time, better preparing their feedback,
- Avoid providing emotional reactions to the material in the session, and
- Take time to discuss the materials with their organizational units and peers so that feedback provided is representative of the larger stakeholder group.
The flow of information in a review session should come from the reviewers as much as possible. This session is one of the final opportunities for the stakeholders to raise questions, seek clarity, and voice concerns. The business analyst can use this session as an opportunity to field questions and seek to close down any open requirements-related issues in preparation for receiving final approval of the requirements.
4.13 Verify Requirements
Verification is the process of reviewing the requirements for errors and quality. Verification may occur before or after validation. Verifying requirements after they have been validated or confirmed by product stakeholders ensures that only the requirements that are considered to be “good” requirements are verified. Validation is concerned about ensuring that the requirements solve the problem—verification is not.
Verification is performed by members of the solution team to ensure that the requirements meet quality standards or any other business analysis deliverable in the process meets the standards of excellence for the organization. There are two types of verification processes: peer reviews and inspections.
4.13.1 Peer Review
Peer reviews can be conducted at any point during the requirements process. In business analysis, a peer review is a formal or informal review of the requirements by the peers of the business analyst. Business analysts may include other practitioners, such as their manager or someone in the Business Analysis Center of Excellence. Quality assurance or testing resources also make great reviewers.
The purpose for the peer review is to ensure that the written business analysis deliverables, including all forms of requirement documentation, are in compliance with the organizational standards and generally held principles of requirements writing. Section 4.11.4 contains examples of these guidelines.
An informal peer review may be held with a couple of business analysts before conducting a requirements review meeting with business stakeholders. This helps to ensure there are no glaring errors in the requirements that could cause problems during the review. Peer reviews may also be held after the review sessions with the business stakeholders to ensure the final document is understood and accepted by the solution team and development community in general.
Conducting a peer review is fairly straightforward. All reviewers are provided with a copy of the document and asked to review the document prior to attending the peer review session. The requirements are reviewed as a group with each reviewer pointing out issues or problems in the document. A form of screen-sharing technology can be used to display the document and make changes to it during the meeting as issues are discussed, thereby saving time and ensuring the errors raised are properly fixed. When a formal session is not conducted, the document can be distributed to the peer review team electronically, asking the reviewers to track their changes in the original document. For organizations who use a requirements management tool, there are a number of features that can be used to track the comments provided by document reviewers.
Collaboration Point—Ask testers and those involved in developing training manuals to be part of the verification review. This provides these team members with the project background and context early on. These team members will focus on the details and check for consistency, completeness, and testability of the requirements, which is beneficial for the verification review.
4.13.2 Inspection
Inspections are a more rigorous form of a peer review. Inspections were initially targeted for hardware development and were later modified to be applicable for anything that needs to be reviewed for accuracy, completeness, and relevance, etc.
In a predictive life cycle process, requirements inspections are typically performed once at the end of the requirements process when the document is ready for final approval. Often, inspections are performed after all of the business stakeholders have had a chance to review and confirm their respective portions of the requirements. The objective is for the business to ensure that the requirements are acceptable in their current form. Inspections can also be performed on groupings or chunks of completed requirements.
The inspection is performed by peers who participated in the creation and documentation of the requirements and are the recipients of the requirements document. Business stakeholders and management are excluded from an inspection session, especially the line management of the inspectors.
A requirements inspection checklist could include the following items:
- Are all internal cross-references to other requirements correct?
- Are all requirements written at a consistent and appropriate level of detail?
- Do the requirements provide an adequate basis for design?
- Is the implementation priority for each requirement included?
- Are all external hardware, software, and communication interfaces defined?
- Have algorithms intrinsic to the functional requirements been defined?
- Is the expected behavior documented for all anticipated error conditions?
A checklist differentiates an inspection from a peer review. A peer review depends on the knowledge of the reviewers whereas the inspection uses a checklist of known defects for the product being inspected. Inspections also follow a more rigorous process than peer reviews and use a series of rules to govern how they are performed.
4.14 Approval Sessions
Approval sessions are conducted separately from confirmation sessions. After the solution is confirmed and validated, the business analyst obtains signoff on the requirements. Signoff may be formal or not and may be predetermined in business analysis planning.
When signatures are sought, there are three signatures that are usually requested:
- Business owner, such as the executive in charge of the business area, who agrees that the requirements represent a complete and accurate solution to the problem.
- Solution team recipient, who accepts the document and acknowledges that it is sufficient to build the documented solution.
- Business analyst, who prepared the deliverable.
Obtaining approval for the requirements should be a fairly automatic procedure. It is rare for a person of authority, such as a vice president or director of the company to take the time to thoroughly read and analyze a complete set of requirements for any given project. They may ask someone closer to the project whether the requirements are acceptable. Since the requirements are confirmed to be correct, accurate, understandable, and implementable, etc., by all of the individual constituencies, obtaining approval from a senior manager should be a routine process. Problems in obtaining approval arise when the lower-level managers or process workers have not seen the requirements yet and are unable to provide a positive opinion about them to the senior manager. For more information about the requirements approval process, see Section 5.4.
4.15 Resolve Requirements-Related Conflicts
Conflicts may arise at any point in the business analysis process. Whether the conflict is between business units voicing opposing views of what the solution should be or a solution team and a product stakeholder disagreeing on the way to solve the business problem, the first order of business is to determine what the problem is that the parties are attempting to solve.
The business analyst mediates the situation by discussing the differences and by understanding the points of view of each stakeholder. Several discussions may need to occur before a resolution is reached. When unable to reach a decision, the issue needs to be escalated. The process for making decisions, resolving requirements-related conflicts, and the escalation path to follow when negotiating efforts fail should have been defined during business analysis planning.
Business analysts require soft skills in negotiation and need to learn how to bring opposing sides to consensus. Facilitating a win-win solution is key. The business analyst also should be capable of analyzing the reasons as to why the conflict exists. There are numerous techniques that can be used to help a team reach a decision or resolve a conflict. Techniques remove subjectivity and emotion from the process. A few examples are listed in Sections 4.15.1 through 4.15.3.
4.15.1 Delphi
The Delphi technique is an information-gathering technique used as a way to reach consensus from experts on a subject. Experts on the subject participate in this technique anonymously. A facilitator uses a questionnaire to elicit ideas about the important points related to the subject. The responses are summarized and are then recirculated to the experts for further comments. Consensus may be reached in a few rounds of this process. The Delphi technique helps to reduce bias in the data and prevents any one person from having undue influence on the outcome.
The Delphi method relies on peer pressure and the wisdom of crowds to produce the correct decision or solution. This technique works well for teams operating from diverse locations.
4.15.2 Multivoting
When applying the multivoting technique to resolve a conflict, the team brainstorms to generate a possible list of options for resolving the conflict. The team decides how many items will be on the final list. All of the items remaining after a first cut of the brainstormed answers or solutions are then numbered. Each participant receives a limited number of votes and is asked to place the votes against the unranked choices. For example, when provided with five votes, a participant is able to place three votes on one choice and two on another. When all members of the team have voted, the votes are tallied and the results posted. When there is a clear decision, the process ends. Otherwise, the total list is adjusted by eliminating those at the bottom and the process is repeated, this time with fewer votes per person. In the end, the decision is based on the option with the highest score.
4.15.3 Weighted Ranking
The same weighted ranking technique used to rank solution options in needs assessment and to prioritize requirements in requirements elicitation and analysis, is applied to resolve requirements-related conflicts. The technique is applied in the same manner: options are listed, ranked, and voted upon. The option with the highest score is selected. Options are typically solution-related. For example, in the case of two requirements that completely conflict with each other, this technique does not compare the requirements to each other, but instead compares the differences between the solution options that represent the requirements.