
1.5 Means and variances
1.5.1 Expectations
Suppose that m is a discrete random variable and that the series
![]()
is absolutely convergent, that is such that
![]()
Then the sum of the original series is called the mean or expectation of the random variable, and we denote it
![]()
A motivation for this definition is as follows. In a large number N of trials, we would expect the value m to occur about p(m)N times, so that the sum total of the values that would occur in these N trials (counted according to their multiplicity) would be about
![]()
so that the average value should be about
![]()
Thus, we can think of expectation as being, at least in some circumstances, a form of very long term average. On the other hand, there are circumstances in which it is difficult to believe in the possibility of arbitrarily large numbers of trials, so this interpretation is not always available. It can also be thought of as giving the position of the ‘centre of gravity’ of the distribution imagined as a distribution of mass spread along the x-axis.
More generally, if g(m) is a function of the random variable and ![]() is absolutely convergent, then its sum is the expectation of g(m). Similarly, if h(m, n) is a function of two random variables m and n and the series
is absolutely convergent, then its sum is the expectation of g(m). Similarly, if h(m, n) is a function of two random variables m and n and the series ![]() is absolutely convergent, then its sum is the expectation of h(m, n). These definitions are consistent in that if we consider g(m) and h(m, n) as random variables with densities of their own, then it is easily shown that we get these values for their expectations.
is absolutely convergent, then its sum is the expectation of h(m, n). These definitions are consistent in that if we consider g(m) and h(m, n) as random variables with densities of their own, then it is easily shown that we get these values for their expectations.
In the continuous case, we define the expectation of a random variable x by
![]()
provided that the integral is absolutely convergent, and more generally define the expectation of a function g(x) of x by
![]()
provided that the integral is absolutely convergent, and similarly for the expectation of a function h(x, y) of two random variables. Note that the formulae in the discrete and continuous cases are, as usual, identical except for the use of summation in the one case and integration in the other.
1.5.2 The expectation of a sum and of a product
If x and y are any two random variables, independent or not, and a, b and c are constants, then in the continuous case

and similarly in the discrete case. Yet more generally, if g(x) is a function of x and h(y) a function of y, then
![]()
We have already noted that the idea of independence is closely tied up with multiplication, and this is true when it comes to expectations as well. Thus, if x and y are independent, then

and more generally if g(x) and h(y) are functions of independent random variables x and y, then
![]()
1.5.3 Variance, precision and standard deviation
We often need a measure of how spread out a distribution is, and for most purposes the most useful such measure is the variance ![]() of x, defined by
of x, defined by
![]()
Clearly if the distribution is very little spread out, then most values are close to one another and so close to their mean, so that ![]() is small with high probability and hence
is small with high probability and hence ![]() is small. Conversely, if the distribution is well spread out then
is small. Conversely, if the distribution is well spread out then ![]() is large. It is sometimes useful to refer to the reciprocal of the variance, which is called the precision. Further, because the variance is essentially quadratic, we sometimes work in terms of its positive square root, the standard deviation, especially in numerical work. It is often useful that
is large. It is sometimes useful to refer to the reciprocal of the variance, which is called the precision. Further, because the variance is essentially quadratic, we sometimes work in terms of its positive square root, the standard deviation, especially in numerical work. It is often useful that

The notion of a variance is analogous to that of a moment of inertia in mechanics, and this formula corresponds to the parallel axes theorem in mechanics. This analogy seldom carries much weight nowadays, because so many of those studying statistics took it up with the purpose of avoiding mechanics.
In discrete cases, it is sometimes useful that
![]()
1.5.4 Examples
As an example, suppose that ![]() . Then
. Then
![]()
After a little manipulation, this can be expressed as
![]()
Because the sum is a sum of binomial ![]() probabilities, this expression reduces to
probabilities, this expression reduces to ![]() , and so
, and so
![]()
Similarly,
![]()
and so
![]()
For a second example, suppose ![]() . Then
. Then

The integrand in the last expression is an odd function of ![]() and so vanishes, so that
and so vanishes, so that
![]()
Moreover,
![]()
so that on writing ![]()
![]()
Integrating by parts (using z as the part to differentiate), we get

1.5.5 Variance of a sum; covariance and correlation
Sometimes we need to find the variance of a sum of random variables. To do this, note that
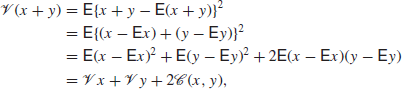
where the covariance ![]() of x and y is defined by
of x and y is defined by
![]()
More generally,
![]()
for any constants a, b and c. By considering this expression as a quadratic in a for fixed b or vice versa and noting that (because its value is always positive) this quadratic cannot have two unequal real roots, we see that
![]()
We define the correlation coefficient ![]() between x and y by
between x and y by
![]()
It follows that
![]()
and indeed a little further thought shows that ![]() if and only if
if and only if
![]()
with probability 1 for some constants a, b and c with a and b having opposite signs, while ![]() if and only if the same thing happens except that a and b have the same sign. If
if and only if the same thing happens except that a and b have the same sign. If ![]() we say that x and y are uncorrelated.
we say that x and y are uncorrelated.
It is easily seen that if x and y are independent then
![]()
from which it follows that independent random variables are uncorrelated.
The converse is not in general true, but it can be shown that if x and y have a bivariate normal distribution (as described in Appendix A), then they are independent if and only if they are uncorrelated.
It should be noted that if x and y are uncorrelated, and in particular if they are independent
![]()
(observe that there is a plus sign on the right-hand side even if there is a minus sign on the left).
1.5.6 Approximations to the mean and variance of a function of a random variable
Very occasionally, it will be useful to have an approximation to the mean and variance of a function of a random variable. Suppose that
![]()
Then if g is a reasonably smooth function and x is not too far from its expectation, Taylor’s theorem implies that
![]()
It, therefore, seems reasonable that a fair approximation to the expectation of z is given by
![]()
and if this is so, then a reasonable approximation to ![]() may well be given by
may well be given by
![]()
As an example, suppose that
![]()
and that z=g(x), where
![]()
so that
![]()
and thus ![]() . The aforementioned argument then implies that
. The aforementioned argument then implies that
![]()
The interesting thing about this transformation, which has a long history [see Eisenhart et al. (1947, Chapter 16) and Fisher (1954)], is that, to the extent to which the approximation is valid, the variance of z does not depend on the parameter π. It is accordingly known as a variance-stabilizing transformation. We will return to this transformation in Section 3.2 on the ‘Reference Prior for the Binomial Distribution’.
1.5.7 Conditional expectations and variances
If the reader wishes, the following may be omitted on a first reading and then returned to as needed.
We define the conditional expectation of y given x by
![]()
in the continuous case and by the corresponding sum in the discrete case. If we wish to be pedantic, it can occasionally be useful to indicate what we are averaging over by writing
![]()
just as we can write ![]() , but this is rarely necessary (though it can slightly clarify a proof on occasion). More generally, the conditional expectation of a function g(y) of y given x is
, but this is rarely necessary (though it can slightly clarify a proof on occasion). More generally, the conditional expectation of a function g(y) of y given x is
![]()
We can also define a conditional varianceas
![]()
Despite some notational complexity, this is easy enough to find since after all a conditional distribution is just a particular case of a probability distribution. If we are really pedantic, then ![]() is a real number which is a function of the real number x, while
is a real number which is a function of the real number x, while ![]() is a random variable which is a function of the random variable
is a random variable which is a function of the random variable ![]() , which takes the value
, which takes the value ![]() when
when ![]() takes the value x. However, the distinction, which is hard to grasp in the first place, is usually unimportant.
takes the value x. However, the distinction, which is hard to grasp in the first place, is usually unimportant.
We may note that the formula
![]()
could be written as
![]()
but we must be careful that it is an expectation over values of ![]() (i.e.
(i.e. ![]() ) that occurs here.
) that occurs here.
Very occasionally we make use of results like
![]()
The proofs are possibly more confusing than helpful. They run as follows:
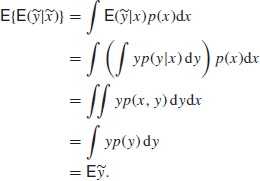
Similarly, we get the generalization
![]()
and in particular
![]()
hence
![]()
while
![]()
from which it follows that
![]()
1.5.8 Medians and modes
The mean is not the only measure of the centre of a distribution. We also need to consider the median from time to time, which is defined as any value x0 such that
![]()
In the case of most continuous random variables there is a unique median such that
![]()
We occasionally refer also to the mode, defined as that value at which the pdf is a maximum. One important use we shall have for the mode will be in methods for finding the median based on the approximation
![]()
or equivalently
![]()
(see the preliminary remarks in Appendix A).