
Chapter 8
Monitoring and Troubleshooting
This chapter covers the following subjects:
Amazon CloudWatch: This section takes a look at the Amazon CloudWatch service, which enables you to collect metrics and logs from your environment and create notifications that can be used with other services to automate responses to any metric going out of bounds.
Amazon CloudTrail: This section covers logging of all API calls to the AWS infrastructure with the Amazon CloudTrail service. The service ensures that you know exactly who made a call, what the user requested, and what response the infrastructure gave. CloudTrail is an important tool in your compliance and governance arsenal.
AWS Config: This section provides a quick overview of AWS Config, which gives you the ability to capture the current state of your AWS account and allows you to track and alert when any kind of configuration change happens in the environment.
Troubleshooting an Application in AWS: This section provides an overview of troubleshooting approaches and recommendations that you should consider when troubleshooting an application in AWS.
This chapter covers content important to the following exam domain:
Domain 5: Monitoring and Troubleshooting
5.1 Write code that can be monitored.
5.2 Perform root cause analysis on faults found in testing or production.
AWS provides a full set of tools that help you keep tabs on the state of your account, your application, and all actions of your users who interact with AWS. Not only are you able to collect metrics and logs from AWS components, you can also collect custom metrics and custom logs from any application running either in AWS or on premises. AWS tools help you gain a complete understanding of what is happening inside your accounts, your applications, your networks, your instances, and even your on-premises deployments at any time.
“Do I Know This Already?” Quiz
The “Do I Know This Already?” quiz allows you to assess whether you should read the entire chapter. Table 8-1 lists the major headings in this chapter and the “Do I Know This Already?” quiz questions covering the material in those headings so you can assess your knowledge of these specific areas. The answers to the “Do I Know This Already?” quiz appear in Appendix A, “Answers to the ‘Do I Know This Already?’ Quizzes and Q&A Sections.”
Table 8-1 “Do I Know This Already?” Foundation Topics Section-to-Question Mapping
Foundations Topics Section |
Questions |
Amazon CloudWatch |
3, 8 |
Amazon CloudTrail |
1, 5 |
AWS Config |
4, 6 |
Troubleshooting an Application in AWS |
2, 7 |
1. To enable encryption, which action needs to be taken on a newly created CloudTrail trail?
CloudTrail trails cannot be encrypted.
Enable encryption when creating the trail.
Select S3-KMS as the encryption mechanism.
None. All trails are encrypted by default with SSE-S3.
2. To handle a 503 error, it is recommended to do which of the following?
Implement exponential back-off
Search through the AWS forums for the payload returned
Open a ticket on AWS support
Check your credentials
3. To monitor several important indicators of application performance, you can create a custom CloudWatch _____.
graph
queue
dashboard
alarm
4. Which service combination would you use to notify an administrator of a change in the state of your environment?
Config, CloudTrail, SNS
Config, CloudTrail, SQS
Config, CloudWatch Alarms, SNS
Config, CloudWatch Alarms, CloudTrail
5. A user has terminated an instance. How can you determine from what IP this deletion call came?
Check the VPC flow log.
Check the CloudTrail log.
Check the ELB connections log.
You can’t. The originating IP address of the user is not recoded in AWS.
6. Which service would enable you to easily determine whether any security policies with publicly open ports exist?
CloudTrail
AWS Config
VPC port logs
CloudFormation
7. A 403 response in AWS indicates which of the following?
This response is for AWS service control only.
A service request cannot be made at this time.
A policy is not allowing the user to perform any action over an AWS resource.
The object does not exist.
8. Which of the following is not a characteristic of CloudWatch logs?
You can collect logs from applications and operating systems.
They allow you to alert with conditions based on log content.
Logs can be uploaded via the CloudWatch logs agent, CLI, or API.
Retention time is limited to 15 months.
Foundation Topics
When you think of monitoring and alerting, you might instinctively think of a dark room with many screens showing graphs and metrics, engineers looking at the screens and their monitors, a red flashing light on the ceiling, a siren whirring. While that might represent a good Hollywood interpretation of monitoring and alerting, the reality is far from it. Modern, well-designed monitoring systems do not need a room full of screens, as most issues are taken care of by automation. Rarely do these systems alert anyone that any action needs to be taken, but in the event that an alert is raised, it can be responded to very promptly. Most of these systems run in the cloud and are, in most cases, accessible via any device from anywhere.
So why is monitoring such a crucial part of application deployment? There is an old saying that operating an environment without monitoring is like flying an airplane blindfolded. You might get lucky and make it pretty far, but sooner or later, you are going to crash. Having a comprehensive overview of what is happening with your application is a must in any application being deployed anywhere. It is crucial to understand what your application is doing from both performance and security points of view. You can use monitoring to better understand the following:
Overall performance: You can determine how many resources an application is consuming.
Over- and underprovisioning: You can determine whether servers constrained or whether they are basking in too many resources.
Outliers: By continuously analyzing the performance metrics, you can build a standard operating pattern for your application. Over time, it will become much easier to identify outliers.
Security: By understanding the operating pattern, you can also quickly identify and react to any potential security breach or attack against your application.
State of logs: By collecting and continuously analyzing logs, you can maintain the state of logs at all times and find ways to improve procedures in case of issues. Logs can start indicating an upcoming issue, and you can implement a proactive remediation approach that relies on early detection of possible issues in the logs and enables you to keep the application alive even when an issue that would otherwise impair it is present.
Learning how to analyze logs is also a step in the data science direction. There are valuable lessons to be learned from log analytics, and these lessons similarly apply to data science. If you are interested in one day performing big data analytics as a data scientist, one way in is through log analytics. Logs are essentially streaming data points. These streaming data points are no different physically from any other data points being collected by traditional big data systems. Logs come in many formats—including unstructured, semi-structured, and fully structured—and you can run search, transformation, analytics, and SQL-like queries on logs. That is basically half of what a data scientist does in a day. Treat your logs well, and they will reward you with the ability to better understand your application and also provide you with a pinch of data science skills.
Amazon CloudWatch
The Amazon CloudWatch service is a metrics and log collection, monitoring, and alerting system that enables you to collect, analyze, and understand the data points being emitted by an application. In addition, you can create alerts to perform programmatic invocation of other AWS services through which you can either notify a response team or completely automate a response to a certain change in resource consumption or log data.
In AWS, all services, instances, and cloud objects are designed to output metrics and sometimes logs into CloudWatch. In addition, you can feed any type of custom metrics, logs, and other data into CloudWatch, which facilitates designing a comprehensive approach to understanding and reacting to changes in monitoring. The metrics in CloudWatch can be simply and easily viewed through the Management Console. In addition, you can retrieve the metrics through the AWS CLI and the CloudWatch API, which can then be integrated into your application via the modules available in the SDKs. This means that you can feed CloudWatch logs into your own logging and monitoring environment, into streaming analytic systems, and into Lambda functions to get a better understanding of the environment you run in AWS as well as the ability to respond to any issues in real time.
Instead of pulling all the metrics into an external system, you can use alarms to perform notifications when a certain metric has breached a certain threshold for a certain period of time. Once an alarm threshold is breached, the alarm triggers and performs a certain action. The simplest action is for the service to send a notification to another service in AWS, such as SNS, which can in turn forward the message to any subscribers subscribed to the topic. Another use of alarms is to trigger AutoScaling actions for your EC2 instances, DynamoDB databases, and other services that support AutoScaling.
For example, when you monitor the aggregate CPU usage of an AutoScaling group, you can set a trigger to inform AutoScaling to add an instance if the aggregate CPU usage is 70% for 10 minutes. Any time the condition is met, AutoScaling performs the action of adding an instance. On the opposite side, you can add a rule to remove an instance if the aggregate CPU usage is below 30% for 10 minutes. In this case, AutoScaling removes the instance if the alarm is triggered.
You can also use this approach for auto-recovery of instances where you add one instance to an AutoScaling group with a minimum of one and a maximum of one. If the instance state changes from healthy to impaired, you can add a trigger that removes and replaces the instance to recover it. CloudWatch is also able to provide scheduled actions where a time-based condition can trigger an alarm that can then send a notification to a Lambda function, start an AWS batch operation, or scale EC2 instances on the basis of time.
The CloudWatch Management Console
This section provides a brief overview of CloudWatch to give you an idea of what sections and features exist for it in the Management Console. If you log in to your AWS account and navigate to CloudWatch, you should see an overview screen with some status and alarm information, as shown in Figure 8-1.

Figure 8-1 The CloudWatch Management Console
In this section, you can quickly and easily select some metrics of interest by clicking Overview and selecting any AWS service, such as EC2, as shown in Figure 8-2.

Figure 8-2 Selecting the EC2 Overview
You now see a nice set of graphs showing the averages and usage details, as shown in Figure 8-3.

Figure 8-3 The EC2 Overview with 12-Hour Metrics
You can set the desired level of detail by clicking a Time range value at the top right of the screen, as demonstrated in Figure 8-4.

Figure 8-4 The EC2 Overview with 3-Hour Metrics
You can also use the Management Console to create dashboards, which can be very useful for getting an overview of important metrics for an application that you can select and customize. To see how this works, you can click the Create dashboard button and name the new dashboard, as shown in Figure 8-5.

Figure 8-5 Creating a New Dashboard
Next, you need to select the type of data to display, as shown in Figure 8-6. For this example, select Line to create a line graph representing CPU usage for an instance. (You can, however, feel free to choose any other metric in your environment.)

Figure 8-6 Selecting a Metric
When you drill down to the metric you would like to use, you can simply select the metric and display the graph. Note that in the example in Figure 8-7, a special filter, CPUUtilization, has been added to the search bar to limit the results to that metric only.

Figure 8-7 Selecting a Metric
After you have selected the metric, it appears on the dashboard, as shown in Figure 8-8. You can add more metrics and arrange your dashboard as you like at this point.

Figure 8-8 Custom Dashboard
Next, take a look at the Alarms section of the Management Console, where you can create a new alarm (see Figure 8-9).

Figure 8-9 Alarms Section
In the Create Alarm dialog box, you can select a metric by drilling down through the interface to exactly the metric you want to use. Figure 8-10 shows the CPUUtilization metric selected for a particular EC2 instance.

Figure 8-10 Adding a Metric to the CloudWatch Alarms Section
Next, you need to set the conditions. Scroll down on the screen and set the desired conditions. In the example in Figure 8-11, the alarm will trigger if the CPU usage is above 50% for more than 5 minutes.

Figure 8-11 Adding a Condition to the CloudWatch Alarms Section
Next, you need to configure actions, as shown in Figure 8-12. In the Configure actions section, you can easily create a new SNS topic and subscribe to the topic with your email. You can also choose a different action at this point if you like.

Figure 8-12 Adding an Action to the CloudWatch Alarms Section
You can complete the alarm creation by giving your alarm a name and a description to make it clear what this alarm does, as shown in Figure 8-13.

Figure 8-13 Adding a Description to a CloudWatch Alarm
After an alarm is created, it displays insufficient data until enough collection periods have passed for it to determine whether the state is OK or ALARM, as shown in Figure 8-14.

Figure 8-14 Newly Created CloudWatch Alarm
Next, look at the Log Groups section. If you have previously tested any Lambda functions from this book, you will see that those logs are still available in the region where you deployed the Lambda functions, as shown in Figure 8-15.

Figure 8-15 Log Groups
With a click on a log group, you can open up the streams, which are just representations of log entries in the log group, as shown in Figure 8-16.

Figure 8-16 Log Streams
By clicking a stream, you can get more information and read the log output straight out of the Management Console, as shown in Figure 8-17.

Figure 8-17 Contents of a Log Stream
Finally, take a look at the metrics section. Here you can drill into the desired metrics and create graphs to visualize the state of your application’s performance, as shown in Figure 8-18. At this point, you should explore the interface a bit to get used to the look and feel.
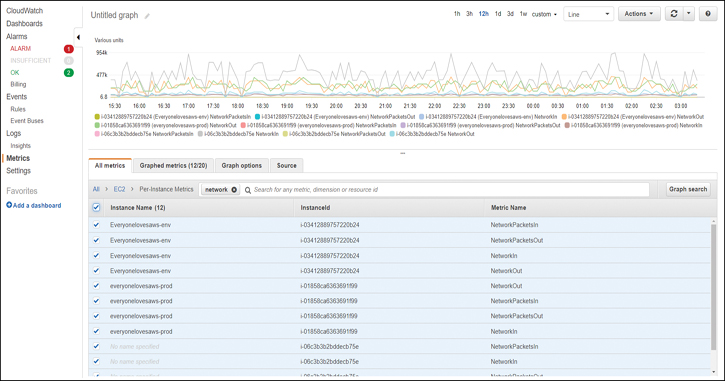
Figure 8-18 Built-in Metrics Graphed in the Metrics Section
Collecting Logs and Metrics
Any metrics, logs, or custom data that CloudWatch receives will be stored into the CloudWatch repository. Repositories are regional, so when you are investigating performance issues and troubleshooting applications that span multiple regions, make sure to navigate to each region that the application resides in and collect the metrics for each part separately. You should also consider the region when configuring on-site metric and log collection so that you select the correct regional endpoint to receive the data. The fact that the metrics are regional also means you need to set up alarms for each application component in the region where the component resides.
Any published metrics need to adhere to the CloudWatch data structure, which has the following components, described in more detail in the sections that follow:
Namespaces
By default, all services logging to CloudWatch need to be configured to log against a certain namespace. The default metrics use the namespaces that represent the service. For example, EC2 instances log all metrics under the EC2 namespace. For example, the CPU utilization for a particular EC2 instance may be represented by the namespace EC2:CPUUtilization:InstanceId:i-12345678abcd.
When you send custom metrics and logs to the CloudWatch service, you can define your own namespace as long as it is not the same as the namespace of a built-in metric. A custom namespace can contain up to 256 alphanumeric characters, periods, hyphens, underscores, forward slashes, hashes, and colons.
Metrics
A metric is represented as a data point collected at a certain point in time. The metric has a value that is the current value in units of consumption for the specified resource. Metrics can represent anything from utilization of a resource such as a CPU in percentage, consumption of space in megabytes, approximate number of messages in a queue, and so on. Metrics can be either built-in or custom. Built-in metrics come in two flavors:
Standard metrics: Metrics collected by default for all AWS services every 5 minutes
Detailed: Metrics collected every 5 minutes for services that you select and enable
All standard metrics are collected at no cost and are available in the CloudWatch service in real time. Enabling detailed metrics carries a cost, which is billed as four custom metrics. Any custom metrics are also billed as a flat monthly fee plus a collection charge for each time a metric is sent up to CloudWatch. With CloudWatch, you can also send up to five data points of a metric in one API call, thus reducing the cost of collecting custom metrics; this makes a lot of sense if you need to collect metrics very frequently because the highest resolution for custom metric collection is 1 second.
From all this, you can see that the number of metrics collected by CloudWatch is, for all intents and purposes, incomprehensible. With hundreds of thousands of clients that all together run millions or even billions of components in their applications, you should consider CloudWatch as one of the marvels of modern engineering. As you can imagine, the service must be designed in a resilient way so that it is available at any time to store tens or even hundreds of billions of data points at the same time. The sheer volume of data being collected, however, means that eventually older metrics need to be discarded to make room for new ones. Because of this, CloudWatch has several rules for retention, as follows:
Custom, sub-minute metrics are aggregated to minute metrics after 3 hours.
One-minute metrics are aggregated to 5-minute metrics after 15 days.
Five-minute metrics are aggregated to hourly metrics after 63 days.
Hourly metrics aggregates are discarded after 15 months.
Dimensions
Dimensions help you identify metrics. For example, if you were to collect all metrics under the EC2:CPUUtilization namespace, you wouldn’t be able to attribute the CPU usage to any of the instances. The dimension InstanceId:i-12345678abcd helps add an identifying component to each metric and make sense of whom it belongs to. Up to 10 dimensions, in key/value pair format, can be assigned to each metric; however, any existing dimensions also count against the limit. Additional dimensions can help you organize the usage data by aggregating the usage across a whole application, deployment, AutoScaling group, and so on and can help you get a better idea of the resource consumption of a particular group.
Statistics
Metrics that are aggregated over time are also assigned statistics that help make sense of any outliers that could be lost due to the aggregation of metrics. CloudWatch automatically adds the following statistics when aggregating metrics:
Minimum: The lowest value within a certain period
Maximum: The highest value within a certain period
Sum: The sum of all values within a certain period
Average: An average of all values within a certain period
SampleCount: The number of values within a certain period
pNN.NN: The value of the percentile (for example, up-time percentage) up to two decimal places
Percentiles
The percentile represents where a certain metric is located among other metrics in the same group. Percentiles are available with some services, such as like EC2, RDS, and Kinesis, and allow you to perform statistical analyses and anomaly detection in your datasets.
CloudWatch Logs
Alongside metrics, CloudWatch also gives us the ability to collect any type of logs. Additionally, the same features that apply to metrics can be applied to logs. You can view a log’s contents in the CloudWatch Management Console, perform analytics directly on the contents and create alarms based on pattern matching from the logs. You can also use CloudWatch Insights to perform advanced queries. The only difference versus the metrics is that logs are by default stored in CloudWatch indefinitely; however, you can set the retention period between 1 day and 10 years. You can also ship logs of a certain date to S3 for durable storage, which can also allow you to simply move life cycle logs of a certain age into Glacier archives.
You can source logs from AWS services such as ELB that can provide HTTP and TCP connection information as well as response latencies, Route 53 to log DNS queries, and Lambda to capture any internal logs and data that would usually be displayed in stdout. You can also use the CloudWatch Logs agent on your EC2 instances and any external servers—on premises or public—to ship operating system, application, connection, error, and other types of logs to CloudWatch.
Storing Metrics and Logs with the AWS CLI
This section takes a look at a few simple commands that can be used to send metrics and logs from an operating system to the CloudWatch service. Remember that you could achieve the same outcomes with the CloudWatch agent, or you can write your own requests in your own application to natively output all data to CloudWatch.
Before uploading any metrics, you need to provide a source. This example simply uses a JSON file that needs to be generated by a process or an application to record the data. This example simulates an application reporting its memory usage to the JSON file. The MetricName parameter is used to identify the metric, and Timestamp and Value represent the current value of the metric at a particular time. You can see that the metrics are collected 5 minutes apart. You can freely change this JSON to anything that would suit your needs, but for the purpose of the demonstration of the power of CloudWatch, this will be sufficient.
Copy the content in Example 8-1 and store it as metric.json.
Example 8-1 Example Metric Input File for CloudWatch
[
  {
     "MetricName": "Memory usage",
     "Timestamp": "Friday, October 17, 2019 10:10:00 PM",
     "Value": 1.48,
     "Unit": "Gigabytes"
  },
  {
     "MetricName": "Memory usage",
     "Timestamp": "Friday, October 17, 2019 10:15:00 PM",
     "Value": 1.54,
     "Unit": "Gigabytes"
  },
 {
     “MetricName”: “Memory usage”,
     “Timestamp”: “Friday, October 17, 2019 10:20:00 PM”,
     “Value”: 1.40,
     “Unit”: “Gigabytes”
  }
]
When you have the file stored on your machine, run the following aws CLI command:
aws cloudwatch put-metric-data --namespace "Memory usage"
--metric-data file://metric.json
Now that the data is in CloudWatch, you can return to the Management Console and view the graph. Navigate to the Metrics section in the region to which you uploaded the data. You should see a custom namespace called Memory usage show up. If you click on this namespace, you should be able to select the Memory usage metric with no dimension. You can then set the time range to match the time range of the collection period. In the file shown in Figure 8-19, the collection was performed on 2019-10-17 between 22:10 and 22:20 p.m. Recommended practice dictates that you add an extra 5 minutes on each side of the graph to clearly represent the values.

Figure 8-19 Selecting the Custom Metric in the CloudWatch Management Console
By clicking Apply, you can view the graph of the changing metric, as shown in Figure 8-20.

Figure 8-20 Custom Metric Graphed
Uploading Logs to CloudWatch
Now let’s look at uploading logs. You need a properly formatted JSON file to be able to import the logs. Each log entry requires a UNIX timestamp, in milliseconds, and a message. Example 8-2 shows the messages count for 5 seconds.
Example 8-2 Sample Log Input File for CloudWatch
[
  {
    "timestamp": 1571372100000,
    "message": "Start counting"
  },
  {
    "timestamp": 1571372101000,
    "message": "One"
  },
 {
    "timestamp": 1571372102000,
    "message": "Two"
  },
  {
    "timestamp": 1571372103000,
    "message": "Three"
  },
  {
    "timestamp": 1571372104000,
    "message": "Four"
  },
  {
    "timestamp": 1571372105000,
    "message": "Five"
  }
]
Save this file as log.json on the machine where you will run the command. Before uploading the log, you need to create a log group:
aws logs create-log-group --log-group-name counting
Next, you need to create a log stream:
aws logs create-log-stream --log-group-name counting
--log-stream-name 20191017
Now you can post your logs to CloudWatch:
aws logs put-log-events --log-group-name counting
--log-stream-name 20191017 --log-events file://log.json
If the logs are accepted, you should see output similar to the following:
{
    "nextSequenceToken": "4960037913255284217128673262025638226861
4992161008555458"
}
However, if your response contains the following structure, with rejectedLogEventsInfo, the logs have not been accepted. Common issues are with the UNIX timestamp or the logs being deemed too old or too new. In the following example, the logs are too old:
{
    "nextSequenceToken": "4960037913255284217128673262025638226861
4992161008555458",
    "rejectedLogEventsInfo": {
        "tooOldLogEventEndIndex": 6
    }
}
To add more logs, you need to specify the sequence token returned in the response from the previous command:
aws logs put-log-events --log-group-name counting
--log-stream-name 20191017 --log-events file://log.json
--sequence-token "4960037913255284217128673239779710649804
8605119133554114"
When your logs are accepted, you should see the log entries in the CloudWatch section of the Management Console, as shown in Figure 8-21.

Figure 8-21 A Custom Log Delivered to CloudWatch
Monitoring EC2 Memory Usage with the CloudWatch Enhanced Monitoring Scripts
CloudWatch is a very useful tool for gathering application operational information, getting baseline performance and log readings, and feeding this data back to development process. However, as you may probably have already noticed, there are a few monitoring data points that you typically want to have to get a better overview of an instance. CloudWatch does not report memory, swap, and disk space utilization of EC2 instances because the hypervisor is designed to just reserve and not read the disk space and memory of the instance. This makes a lot of sense because reporting all that information would expose another level of access to the applications and your data.
You need to monitor memory, disk, and swap usage from within the operating system. This makes sense because using the OS is the only way to access the physical memory and disk dedicated to the EC2 instance. AWS does not leave you completely helpless in this aspect; the CloudWatch developers were kind enough to offer a simple set of scripts that you can use to report memory, swap, and disk usage to CloudWatch.
Let’s take a look at the process of installing scripts and reporting memory usage automatically through a Linux cron job. This example uses the Amazon Linux instance; however, you can find instructions for other supported platforms at https://docs.aws.amazon.com/AWSEC2/latest/UserGuide/mon-scripts.html.
You need to add to the instance a role that has access to CloudWatch. Create a new role with the sample policy shown in Example 8-3. This policy has the required permissions to run these scripts. Attach the newly created role to the EC2 instance that you want to monitor or add the ec2:DescribeInstances, cloudwatch:PutMetricData, cloudwatch:GetMetricData, and cloudwatch:GetMetricStatistics permissions to your existing role.
Example 8-3 IAM Policy That Allows You to Write and Retrieve Metrics and Logs to and from CloudWatch
{
    "Version": "2012-10-17",
    "Statement": [
       {
            "Effect": "Allow",
            "Action": [
                "ec2:DescribeInstances",
                "cloudwatch:PutMetricData",
                "cloudwatch:GetMetricData",
                "cloudwatch:GetMetricStatistics"
            ],
            "Resource": "*"
        }
    ]
}
Next, you need to install the prerequisites. The scripts are written in Perl and use the HTTPS protocol. To install all the required components, you need to run the following command:
sudo yum install -y perl-Switch perl-DateTime perl-Sys-Syslog
perl-LWP-Protocol-https perl-Digest-SHA.x86_64
Next, download and extract the monitoring scripts from the repository:
curl https://aws-cloudwatch.s3.amazonaws.com/downloads/
CloudWatchMonitoringScripts-1.2.2.zip -O

unzip CloudWatchMonitoringScripts-1.2.2.zip
Once this file is unzipped, a new directory called aws-scripts-mon appears. Enter the directory and test the script:
cd aws-scripts-mon
./mon-put-instance-data.pl --mem-util --verify --verbose
The test simply verifies the permissions and does not write any content to CloudWatch. If the test passes, you can simply run the command again—this time without the --verify switch:
./mon-put-instance-data.pl --mem-used-incl-cache-buff
--mem-util --mem-used --mem-avail
To automate the delivery of the memory and disk usage metrics, you can add the following line to your cron configuration:
*/5 * * * * ~/aws-scripts-mon/mon-put-instance-data.pl
--mem-used-incl-cache-buff --mem-util --disk-space-util
--disk-path=/ --from-cron
This cron job uploads both the memory and disk utilization metrics every 5 minutes. Note that the cron job runs under the current user.
Amazon CloudTrail
The CloudTrail service enables you to collect each and every call to all the AWS APIs. This enables you to know which user or service initiated every action, where it was initiated from, and the content of the response to the action. By default, all AWS accounts now have a 90-day CloudTrail history of all actions enabled, but you can also create custom trails. Each trail gives you the ability to record either all or just some specific API calls and also gives you the option to add a CloudWatch alarm for any specific type of CloudTrail event.
For example, you might want to secure your account with administrative roles. You can create a specific trail that will look only for role assumptions across your account and alert when any admin roles are assumed. The alert can be used to inform other AWS services; for example, an email or SMS notification can be sent to inform an incident response team of the role assumption.
Another approach is to completely automate the security. To do so, you set up a database where all approved role assumptions need to be recorded in advance. The combination of the username and the allowed time for role assumption can be used to determine whether an assumption is valid or whether it is an attack. When the role is assumed, the notification can invoke a Lambda function that looks up the username and assumption time in the database. If the user is allowed to assume the role, the Lambda function exits; however, if the user is not allowed to assume the role, Lambda can immediately connect to the Security Token Service and invalidate the credentials that have been issued to the user that assumed the role. At the same time, a notification can be forwarded to the incident response team if Lambda invalidates credentials.
CloudTrail Security
All data collected by CloudTrail is automatically encrypted with SSE-S3 and outputted to a specific S3 bucket that you select when configuring a trail. You can also encrypt all CloudTrail logs by using a custom key through KMS. In addition, you can enable CloudTrail log file integrity validation to create MD-5 hashes of files delivered to the trail bucket and store them in a hash file. The hash file lets you compare the hashes to the files and determine whether the files have been tampered with.
CloudTrail Log Structure
Each CloudTrail log has four distinct sections that help you determine the following:
Who requested the action
Where the request originated from
What was requested
The response
Example 8-4 shown an example of a CloudTrail log. In this example, the user test has successfully created a new policy called EC2-CloudWatch-Scripts in IAM. As you can imagine, if the user were being denied the action, the log would look very similar except for the response part, which would not contain any returned content.
Example 8-4 cuts the log into the four relevant sections noted in the preceding list.
Example 8-4 Sample CloudTrail Log Content
{
    "eventVersion": "1.05",
    "userIdentity": {
        "type": "IAMUser",
        "principalId": "AAAAEXAMPLEPRINCIPAL01",
        "arn": "arn:aws:iam::111222333444:user/test",
        "accountId": "111222333444",
        "accessKeyId": "ABCDEXAMPLEKEY01",
        "userName": "test",
        "sessionContext": {
            "attributes": {
                "mfaAuthenticated": "true",
                "creationDate": "2019-10-18T01:00:50Z"
            }
        },
        "invokedBy": "signin.amazonaws.com"
    },
    "eventTime": "2019-10-18T01:25:18Z",
    "eventSource": "iam.amazonaws.com",
    "eventName": "CreatePolicy",
    "awsRegion": "us-east-1",
    "sourceIPAddress": "123.45.67.89",
    "userAgent": "signin.amazonaws.com",
    "requestParameters": {
        "policyDocument": "{
    "Version": "2012-10-17",
    "Statement":
[
        {
            "Sid":
            "Effect": "Allow",

"Action": [
                "ec2:DescribeInstances",

"cloudwatch:PutMetricData",
                "cloudwatch:GetMetricData",

                "cloudwatch:GetMetricStatistics"
            ],

            "Resource": "*"
        }
    ]
}",
        "policyName": "EC2-CloudWatch-Scripts"
    },
    "responseElements": {
        "policy": {
            "policyName": "EC2-CloudWatch-Scripts",
            "defaultVersionId": "v1",
            "attachmentCount": 0,
            "createDate": "Oct 18, 2019 1:25:18 AM",
            "permissionsBoundaryUsageCount": 0,
            "isAttachable": true,
            "arn": "arn:aws:iam::111222333444:policy/EC2-CloudWatch-Scripts",
            "path": "/",
            "updateDate": "Oct 18, 2019 1:25:18 AM",
            "policyId": "AAAEXAMPLEPOLICY01"
        }
    },
    "requestID": "1234-abcd-5678",
    "eventID": "9876-fedc-5432",
    "eventType": "AwsApiCall",
    "recipientAccountId": "111222333444"
}
As you can see, CloudTrail is an invaluable tool that can help you maintain compliance, simplify auditing, and identify any malicious activity due to internal breaches or compromised credentials.
AWS Config
AWS Config is an important monitoring and troubleshooting tool that enables you to capture the complete state of your environment in your AWS account with a configuration snapshot. With such a configuration snapshot, you can easily assess, audit, and evaluate the configuration of all the resources running inside your account or organization. Config enables you to maintain compliance by recording configuration snapshots that can be compared against a desired state and thus determine if the applications running inside your account are compliant with the policy rules that you assign to them.
With AWS Config, you can discover resource changes and track the state of the objects in your account over time. By also using CloudTrail, you can determine which actions led to the state of the environment at a certain point in time. You can also monitor changes to your application to determine whether the changes were approved. This can be highly beneficial in DevOps scenarios running fully automated CI/CD deployments and in any other fast-paced development environments where changes are frequently rolled out automatically across multiple environments multiple times a day.
AWS Config enables you to build in continuous monitoring, continuous assessment, and continuous reaction mechanisms and quickly react to any unauthorized changes through integration with CloudWatch alarms.
Troubleshooting an Application in AWS
You have seen so far that AWS provides a three-pronged approach to gaining a complete understanding of your environment:
You monitor performance with AWS CloudWatch.
You monitor access with Amazon CloudTrail.
You monitor the state of your application with AWS Config.
The general rule in AWS is that if you have deployed an application according to the AWS best practices for performance, high availability, resilience, security, and operational excellence, the application should work seamlessly, and you need to simply keep an eye on the application with AWS tools to gain an understanding of the operating pattern of your application, access patterns of your users and state changes, and their effects on your applications over time. Instead of troubleshooting, you should focus your efforts on improving your application over time.
But of course errors do happen in scripts, templates, and security policies. Because all calls against AWS are standard HTTP API calls, you can expect only two types of error-indicating responses:
HTTP 4xx responses: Indicate that the problem is with your query
HTTP 5xx responses: Indicate a service issue on AWS
The following are common examples of HTTP 4xx responses coming from AWS services:
400 - bad request: Any 400 error includes a response identifier such as InvalidAction, MessageRejected, or RequestExpired. Make sure to read the 400 payload and handle the error in the application. A specific response by some services will indicate throttling, which indicates that requests are being sent too fast. In such a case, you should retry the requests with an exponential back-off approach, where you wait for an increasingly longer time to retry the request.
403 - access denied: Check all the policies that apply to the identity principal, including any group policies, inline policies, bucket policies and ACLs, SQS queue policies, and API gateway policies. Remember that all policies combine together, so a deny in any of the policies will deny access across the board.
404 - page not found: The object specified in a query does not exist.
With HTTP 5xx responses, you usually see only the following two responses:
500 - internal failure: The request failed due to an internal error on an operational service on the AWS side. Systems and services running on them fail all the time, even in AWS. In such a situation, you can immediately retry the request and will probably succeed on the second try.
503 - service unavailable: The request failed due to a service error on the AWS side. This means that the service is temporarily unavailable, indicating a major failure in AWS. You can retry, but the recommended approach is to use the same exponential back-off approach as with the 400 throughput exception errors.
Exam Preparation Tasks
To prepare for the exam, use this section to review the topics covered and the key aspects that will allow you to gain the knowledge required to pass the exam. To gain the necessary knowledge, complete the exercises, examples, and questions in this section in combination with Chapter 9, “Final Preparation,” and the exam simulation questions in the Pearson Test Prep Software Online.
Review All Key Topics
Review the most important topics in this chapter, noted with the Key Topics icon in the outer margin of the page. Table 8-2 lists these key topics and the page number on which each is found.
Table 8-2 Key Topics for Chapter 8
Key Topic Element |
Description |
Page Number |
Section |
The CloudWatch Management Console |
262 |
Section |
Storing Metrics and Logs with the AWS CLI |
271 |
Example Metric Input File for CloudWatch |
272 |
|
Sample Log Input File for CloudWatch |
273 |
|
Section |
Monitoring EC2 Memory Usage with the CloudWatch Enhanced Monitoring Scripts |
275 |
Sample CloudTrail Log Content |
278 |
Define Key Terms
Define the following key terms from this chapter and check your answers in the glossary:
Q&A
The answers to these questions appear in Appendix A. For more practice with exam format questions, use the Pearson Test Prep Software Online.
1. Complete this sentence: The best way to allow an EC2 instance to access CloudWatch is through _______.
2. What is the default retention time when delivering logs to CloudWatch?
3. True or false: In CloudTrail, the ability to detect recent actions against AWS APIs needs to be specifically enabled.
4. Which service or combination of services are needed to determine the request content being sent to a particular service in AWS?
5. True or false: Memory metrics for EC2 instances are not available in CloudWatch by default.
6. When sending logs to CloudWatch, what type of timestamp needs to be included?
7. What is an AWS Config configuration snapshot?
8. True or false: You need to handle a 4xx application error.
9. What kind of status for your request does a 500 response from AWS indicate?
10. What levels of collection does CloudWatch support for built-in and custom metrics?